Interpreting Cimate Data 10/8/2026
This Dashboard links you to extensive resources for investigating all kinds of climate topics.
For the individual websites listed below we include a representative screenshot, below which you can find multiple links to specific site resources.
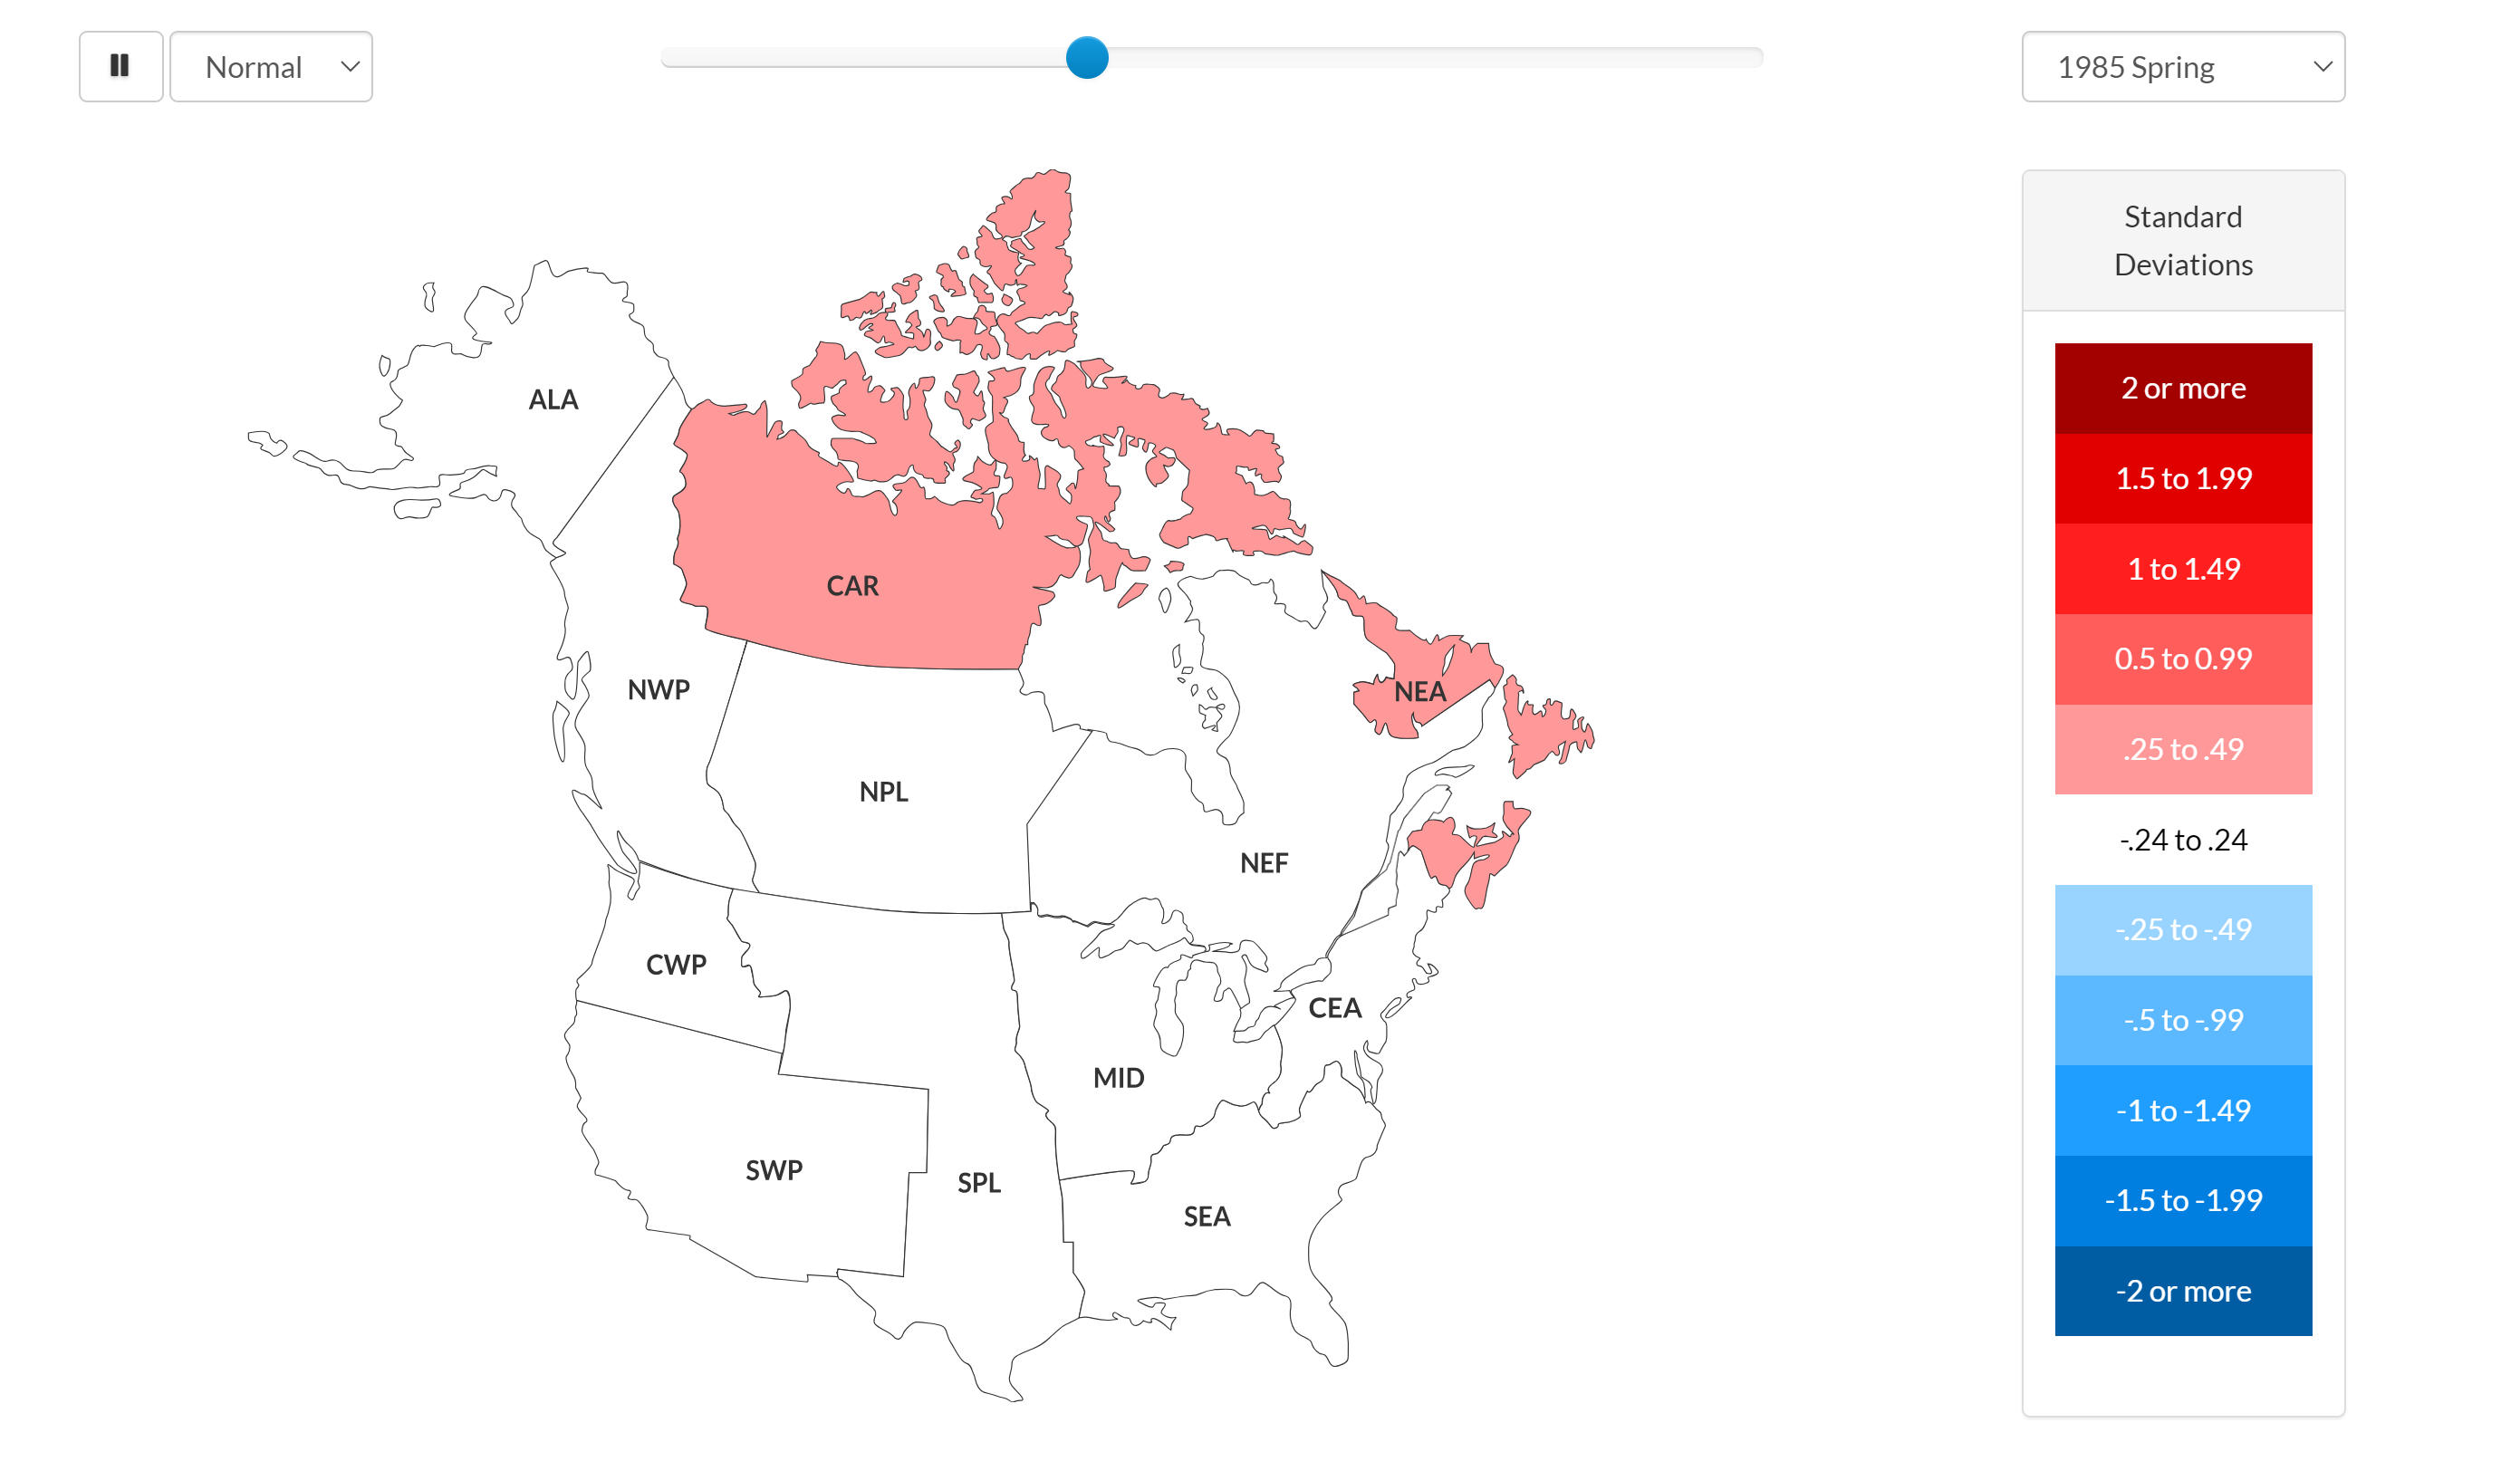
Actuaries Climate Index
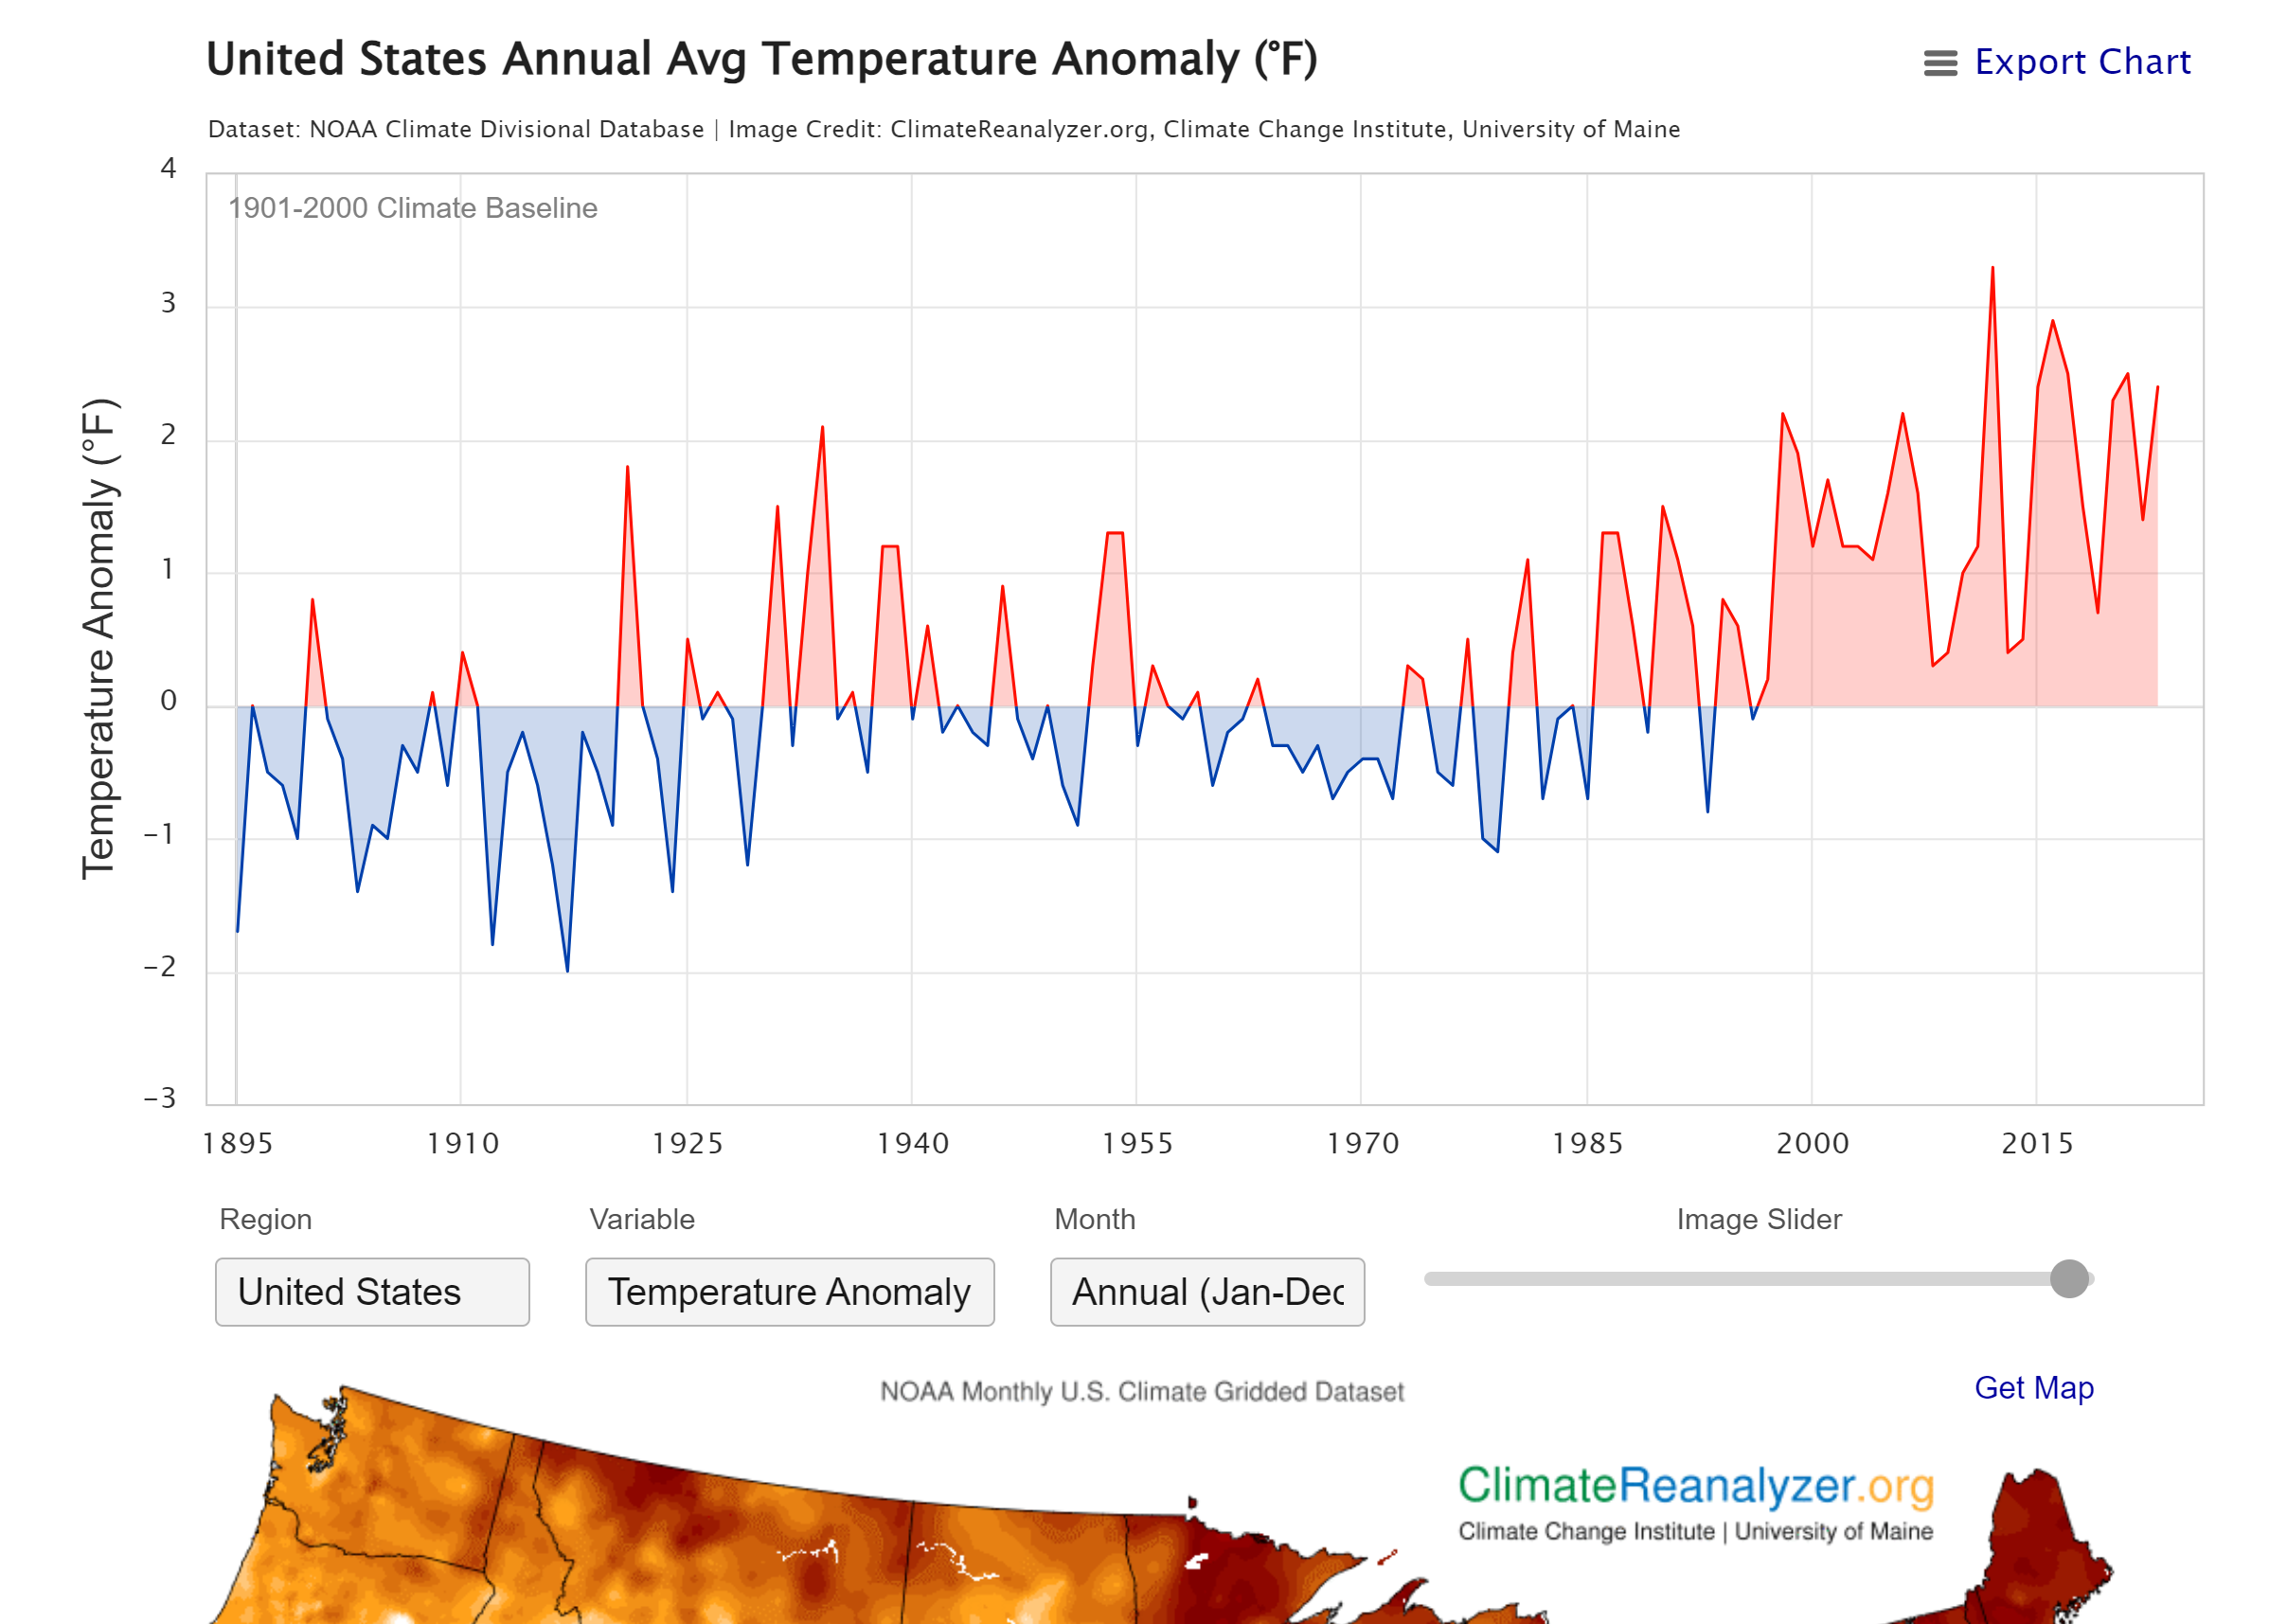
Climate Reanalyzer Assessment of U.S. Data and Trends
NASA Global Earth Observatory
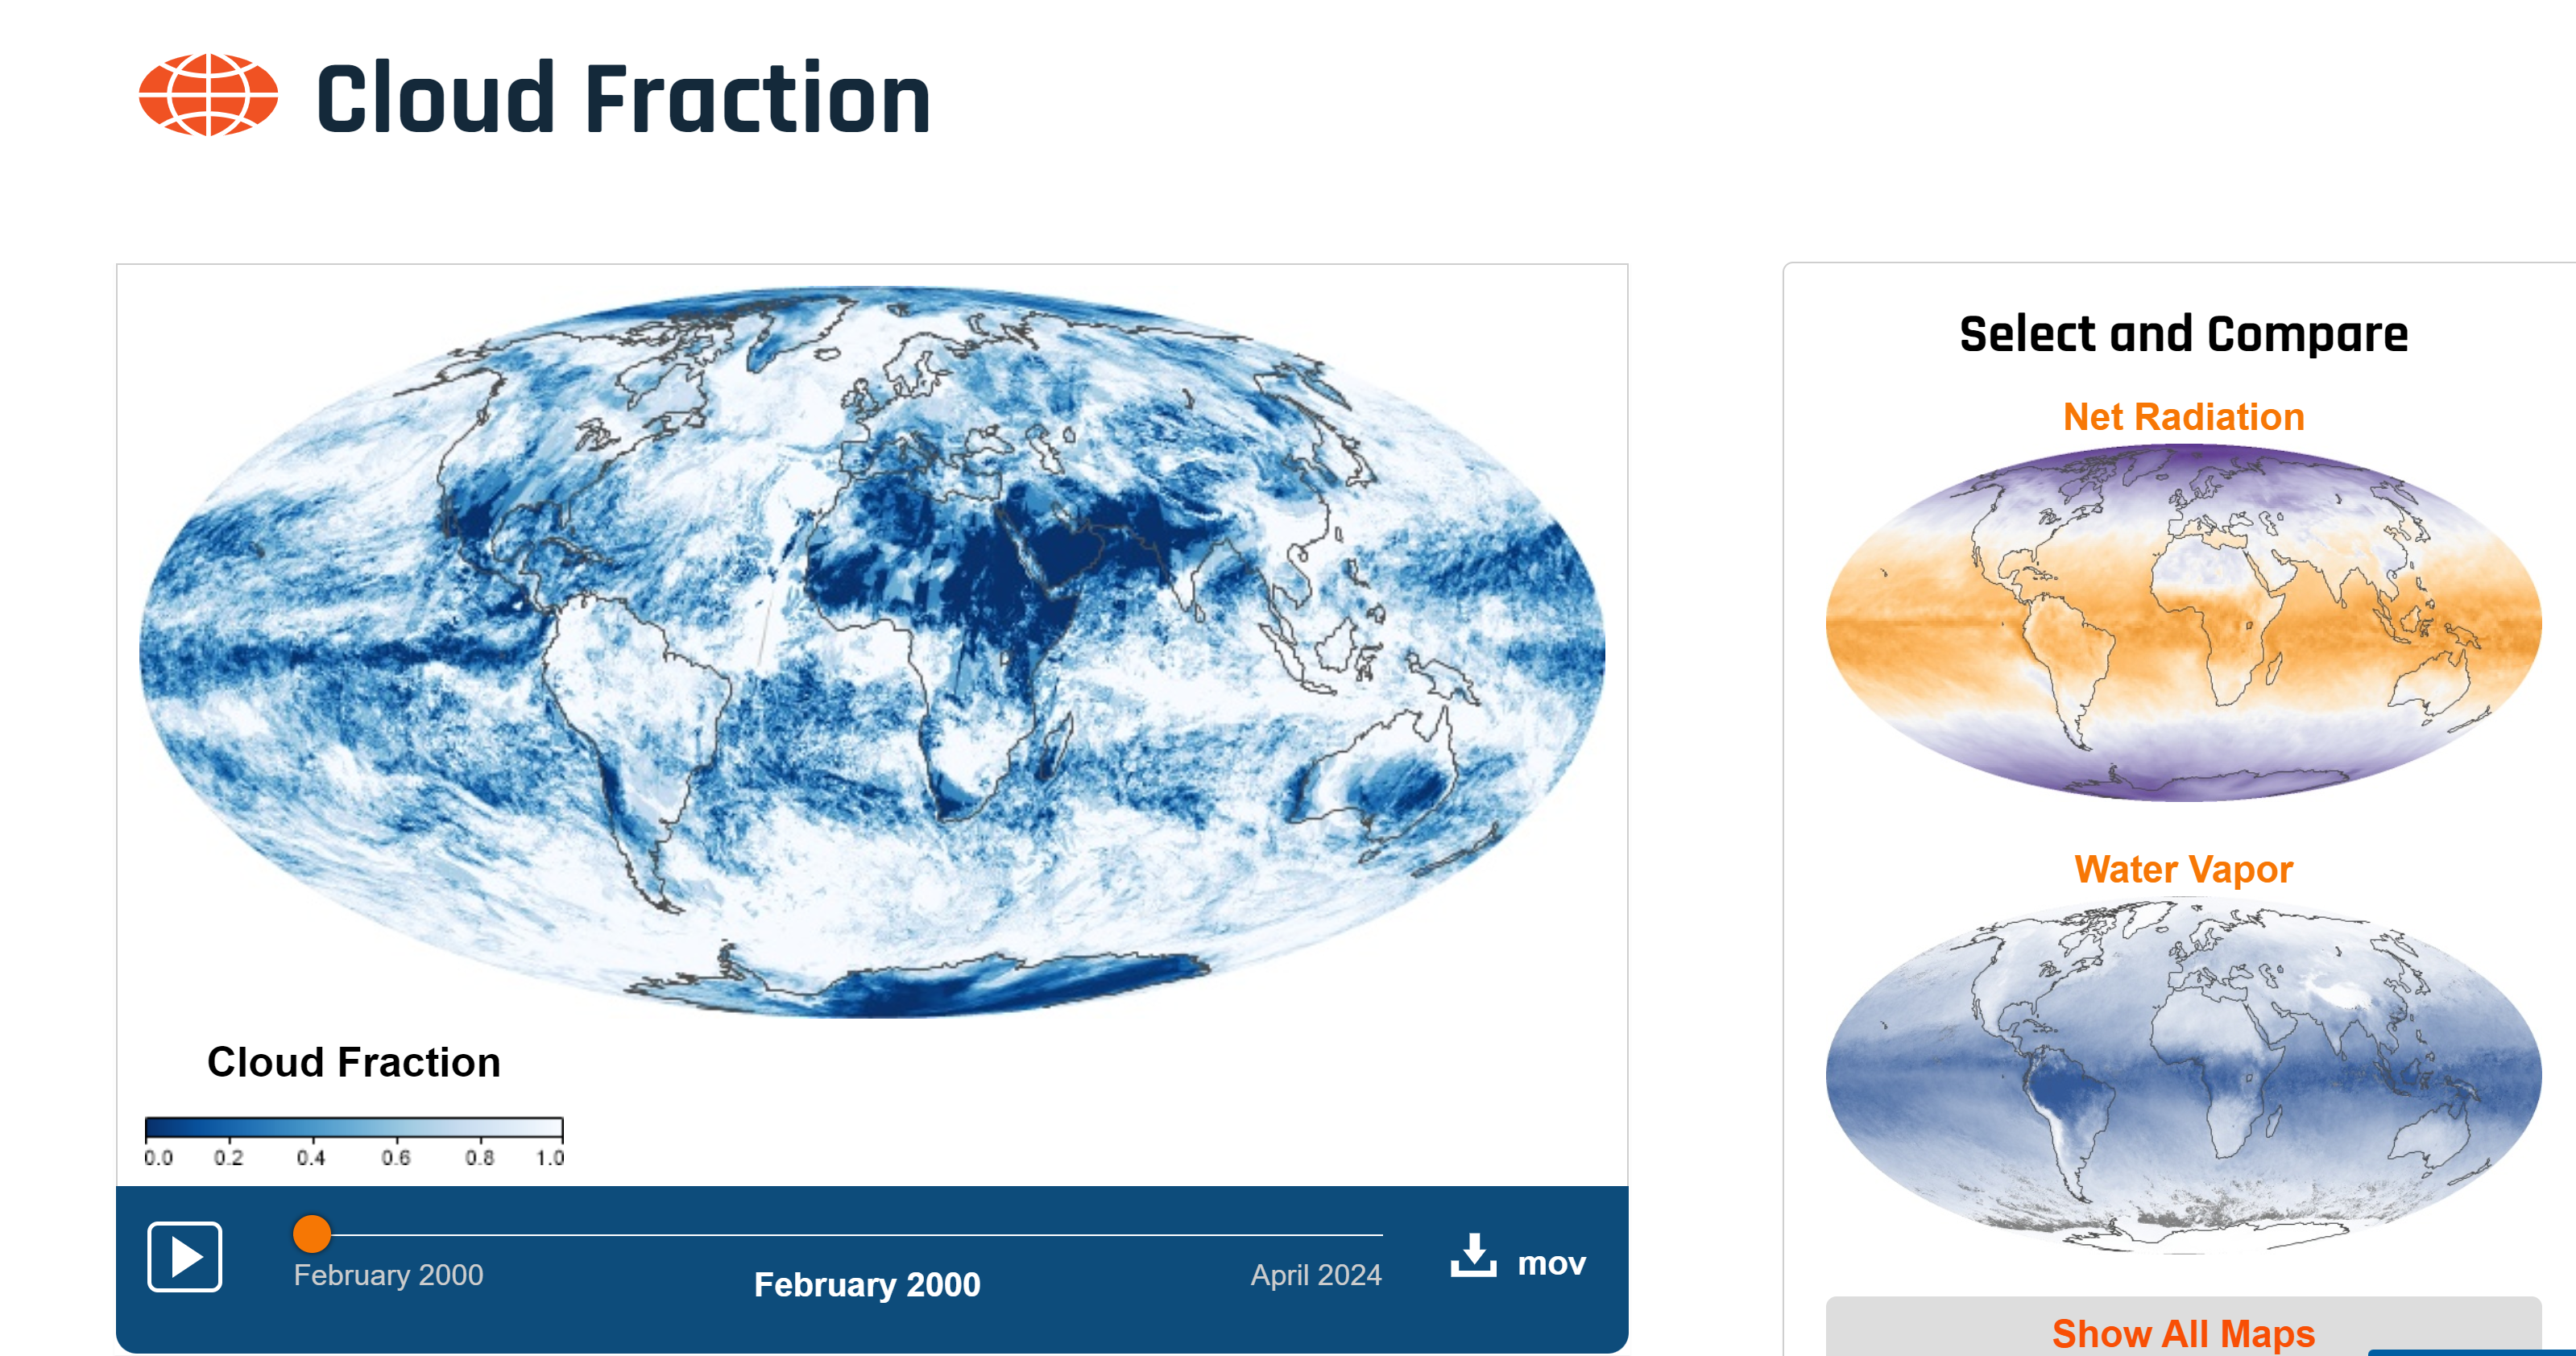
Aerosol Optical Depth Carbon Monoxide Chlorophyll Concentrations Cloud Fraction Earth’s Net Radiation Fire Land Surface Temperature Land Surface Temperature Anomaly Sea Surface Temperature Snow Cover Total Rainfall Vegetation Water Vapor
NOAA’s National Centers for Environmental Information
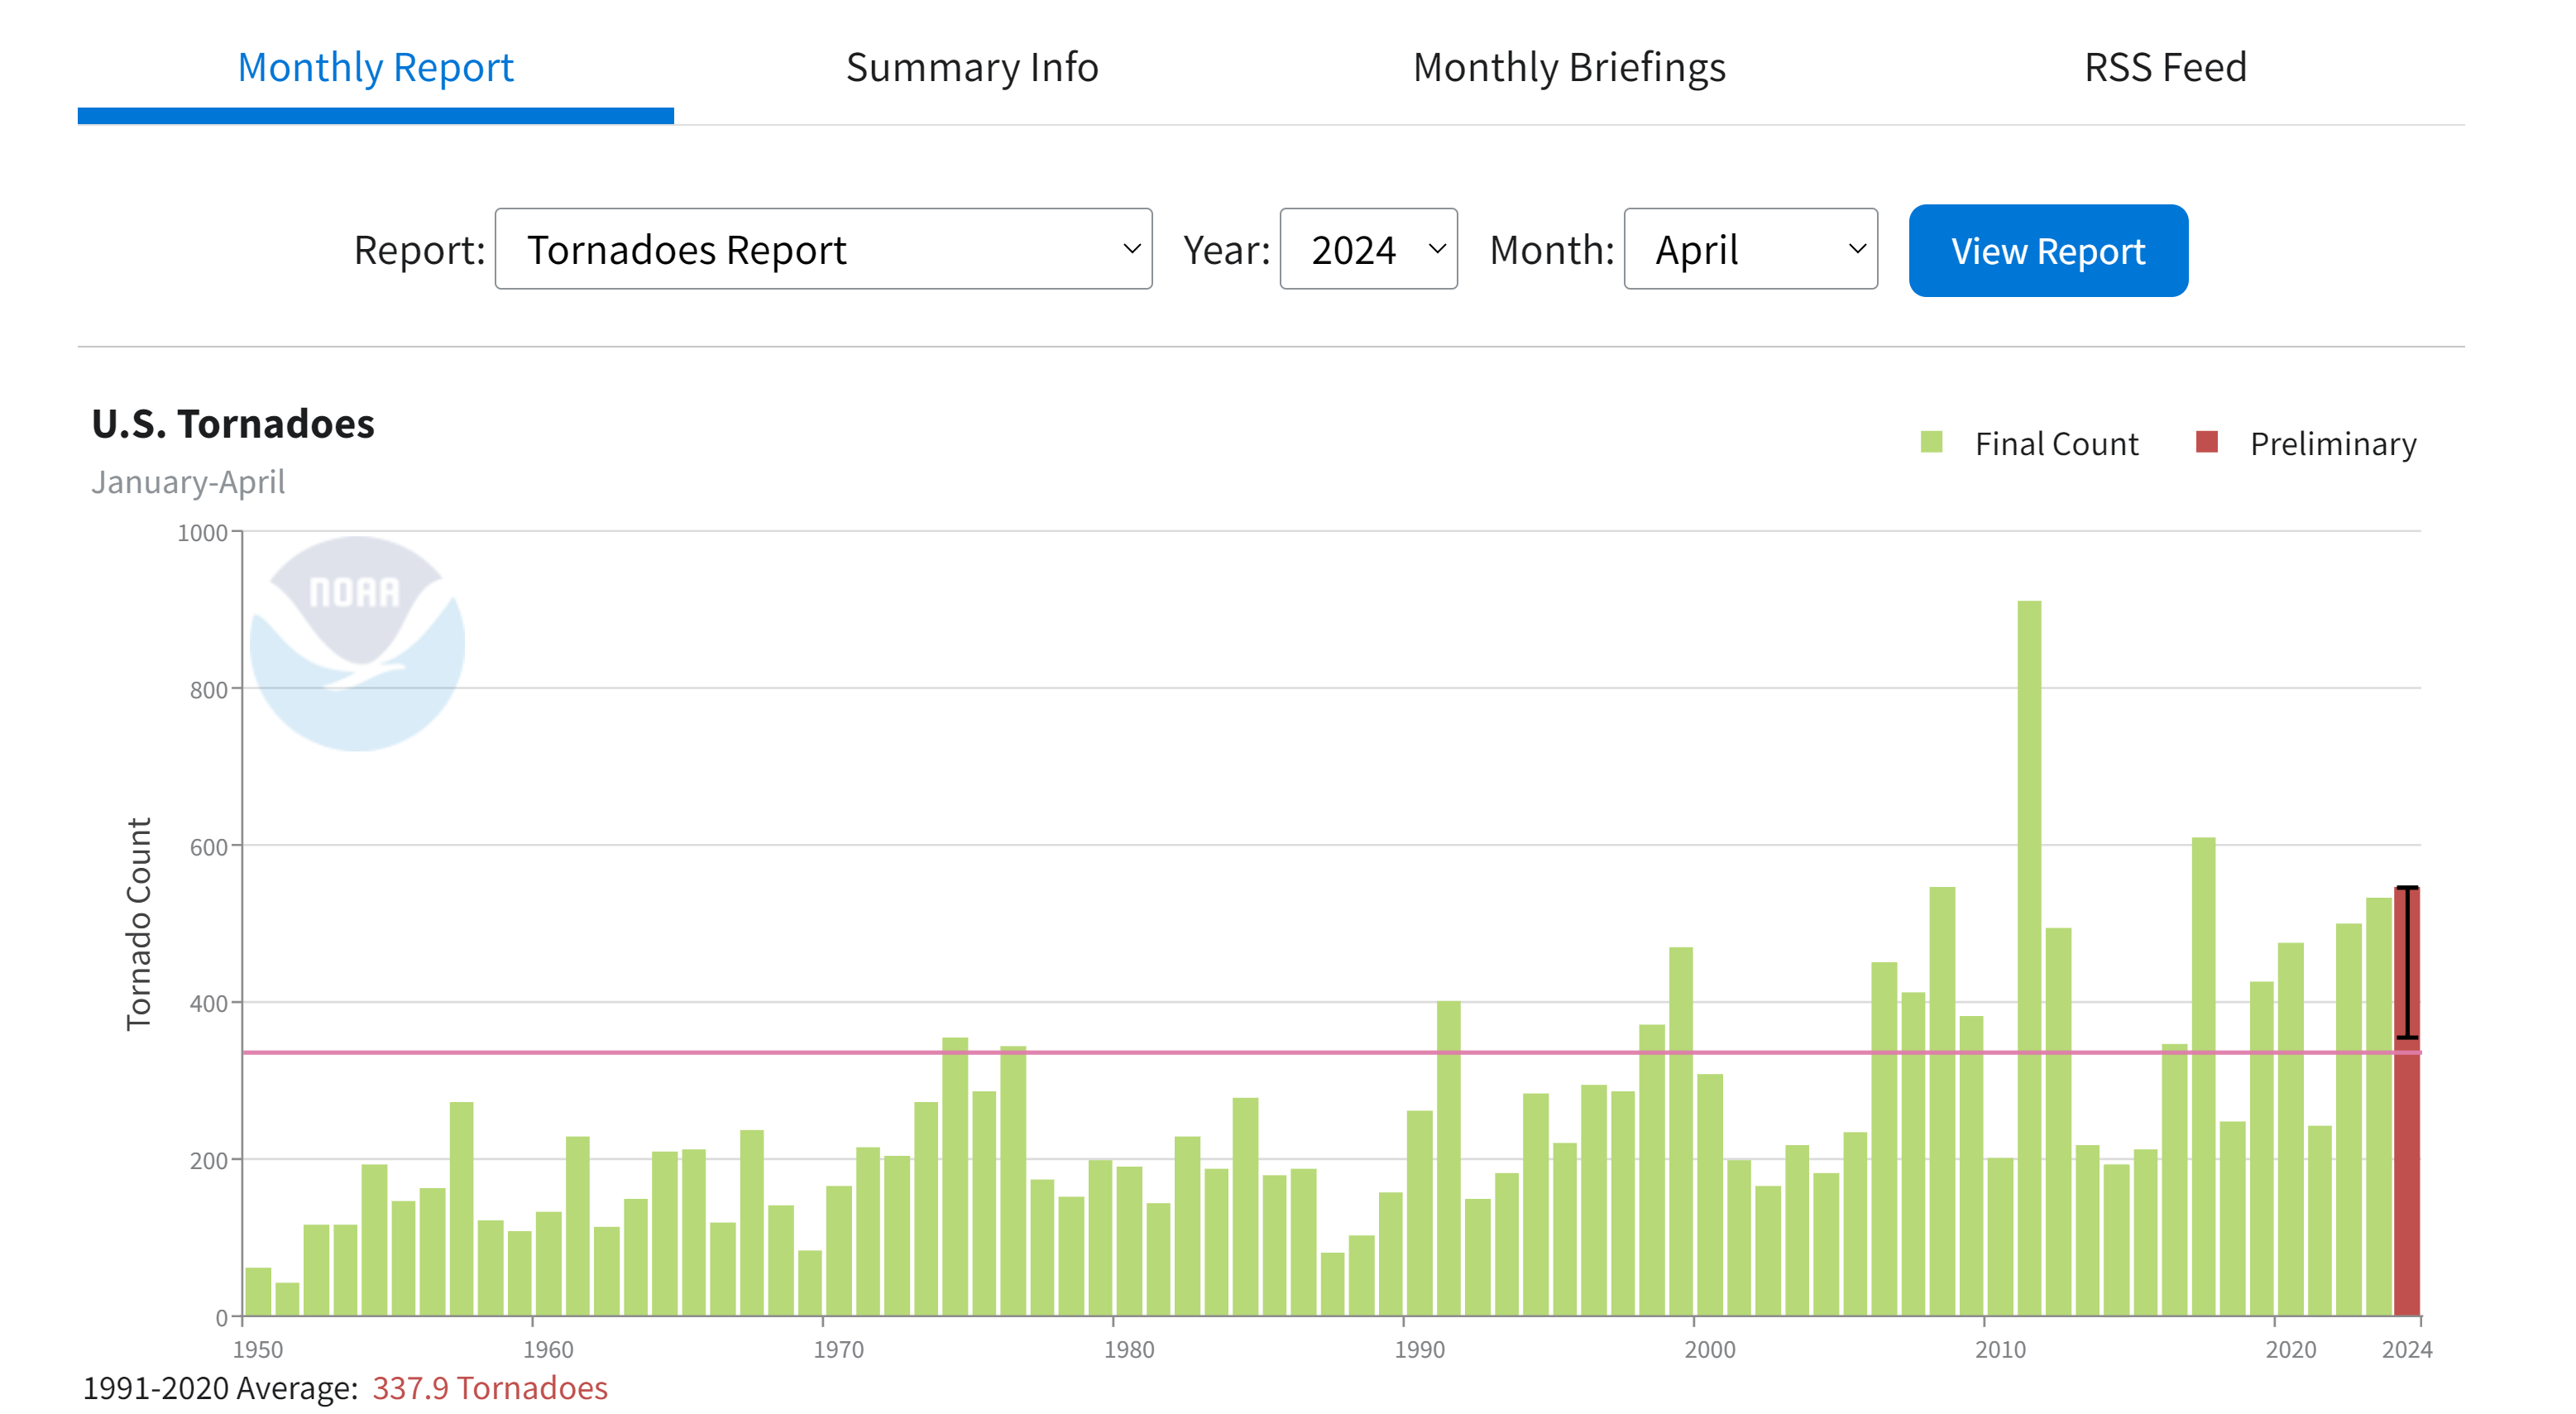
Global Haywood Time Series Global Temperature Anomalies Monthly Assessment of U.S. Climate Monthly Assessment of the Global Climate Monthly U.S. Wildfires Report Monthly U.S. Drought Report Monthly Synoptic Discussion of the U.S. Climate Monthly Global Drought Narrative Monthly Tropical Cyclones Report 2023 U.S. Billion-Dollar Events, Risks, Time-Series and More Atmospheric Carbon Dioxide Monthly Global Drought Narrative Monthly Global Regional Analysis Monthly Temperature Anomalies Monthly U.S. National Climate Report National Overview - June 2016 NOAA Billion-Dollar Weather and Climate Disasters NOAA U.S. Climate Extremes Index (CEI): Graph November 2023 Global Snow and Ice Report U.S. Climate Extremes Index (CEI): Graph U.S. Daily, Monthly, All Time Weather Records Summary
Climate.gov’s Understanding Climate
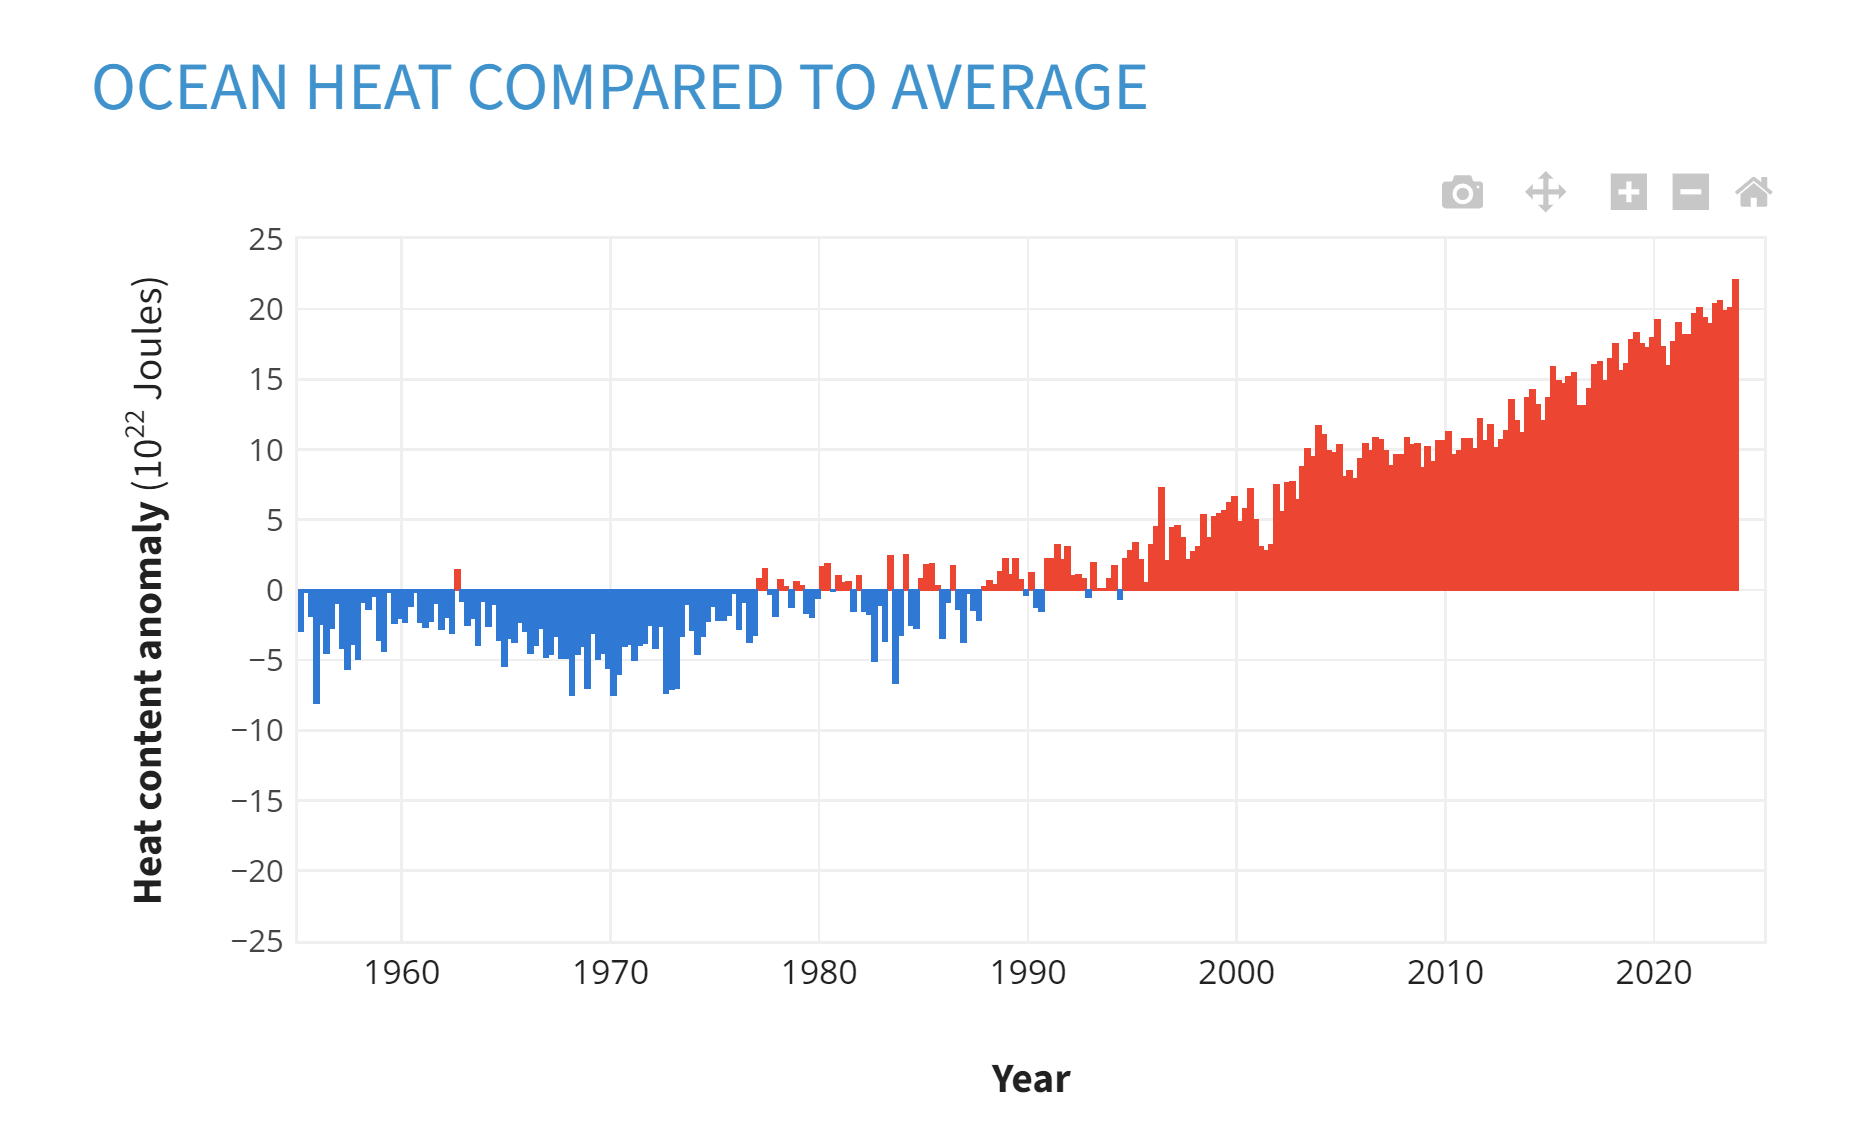
Incoming Solar Energy Annual Greenhouse Gas Index Atmospheric Carbon Dioxide Average Global Temperature Change Arctic Sea Ice Summer Minimum Northern Hemisphere Spring Snow Cover Mountain Glacier Mass Balance Global Sea Level Rise Ocean Heat Content Change Arctic Oscillation North Atlantic Oscillation Oceanic Niño Index
EPA’s Climate Change Indicators
NOTE: The U.S. EPA has deleted the Climate Indicators pages listed below. We're hoping to find the datasets at another source, at which point we'll update this page.
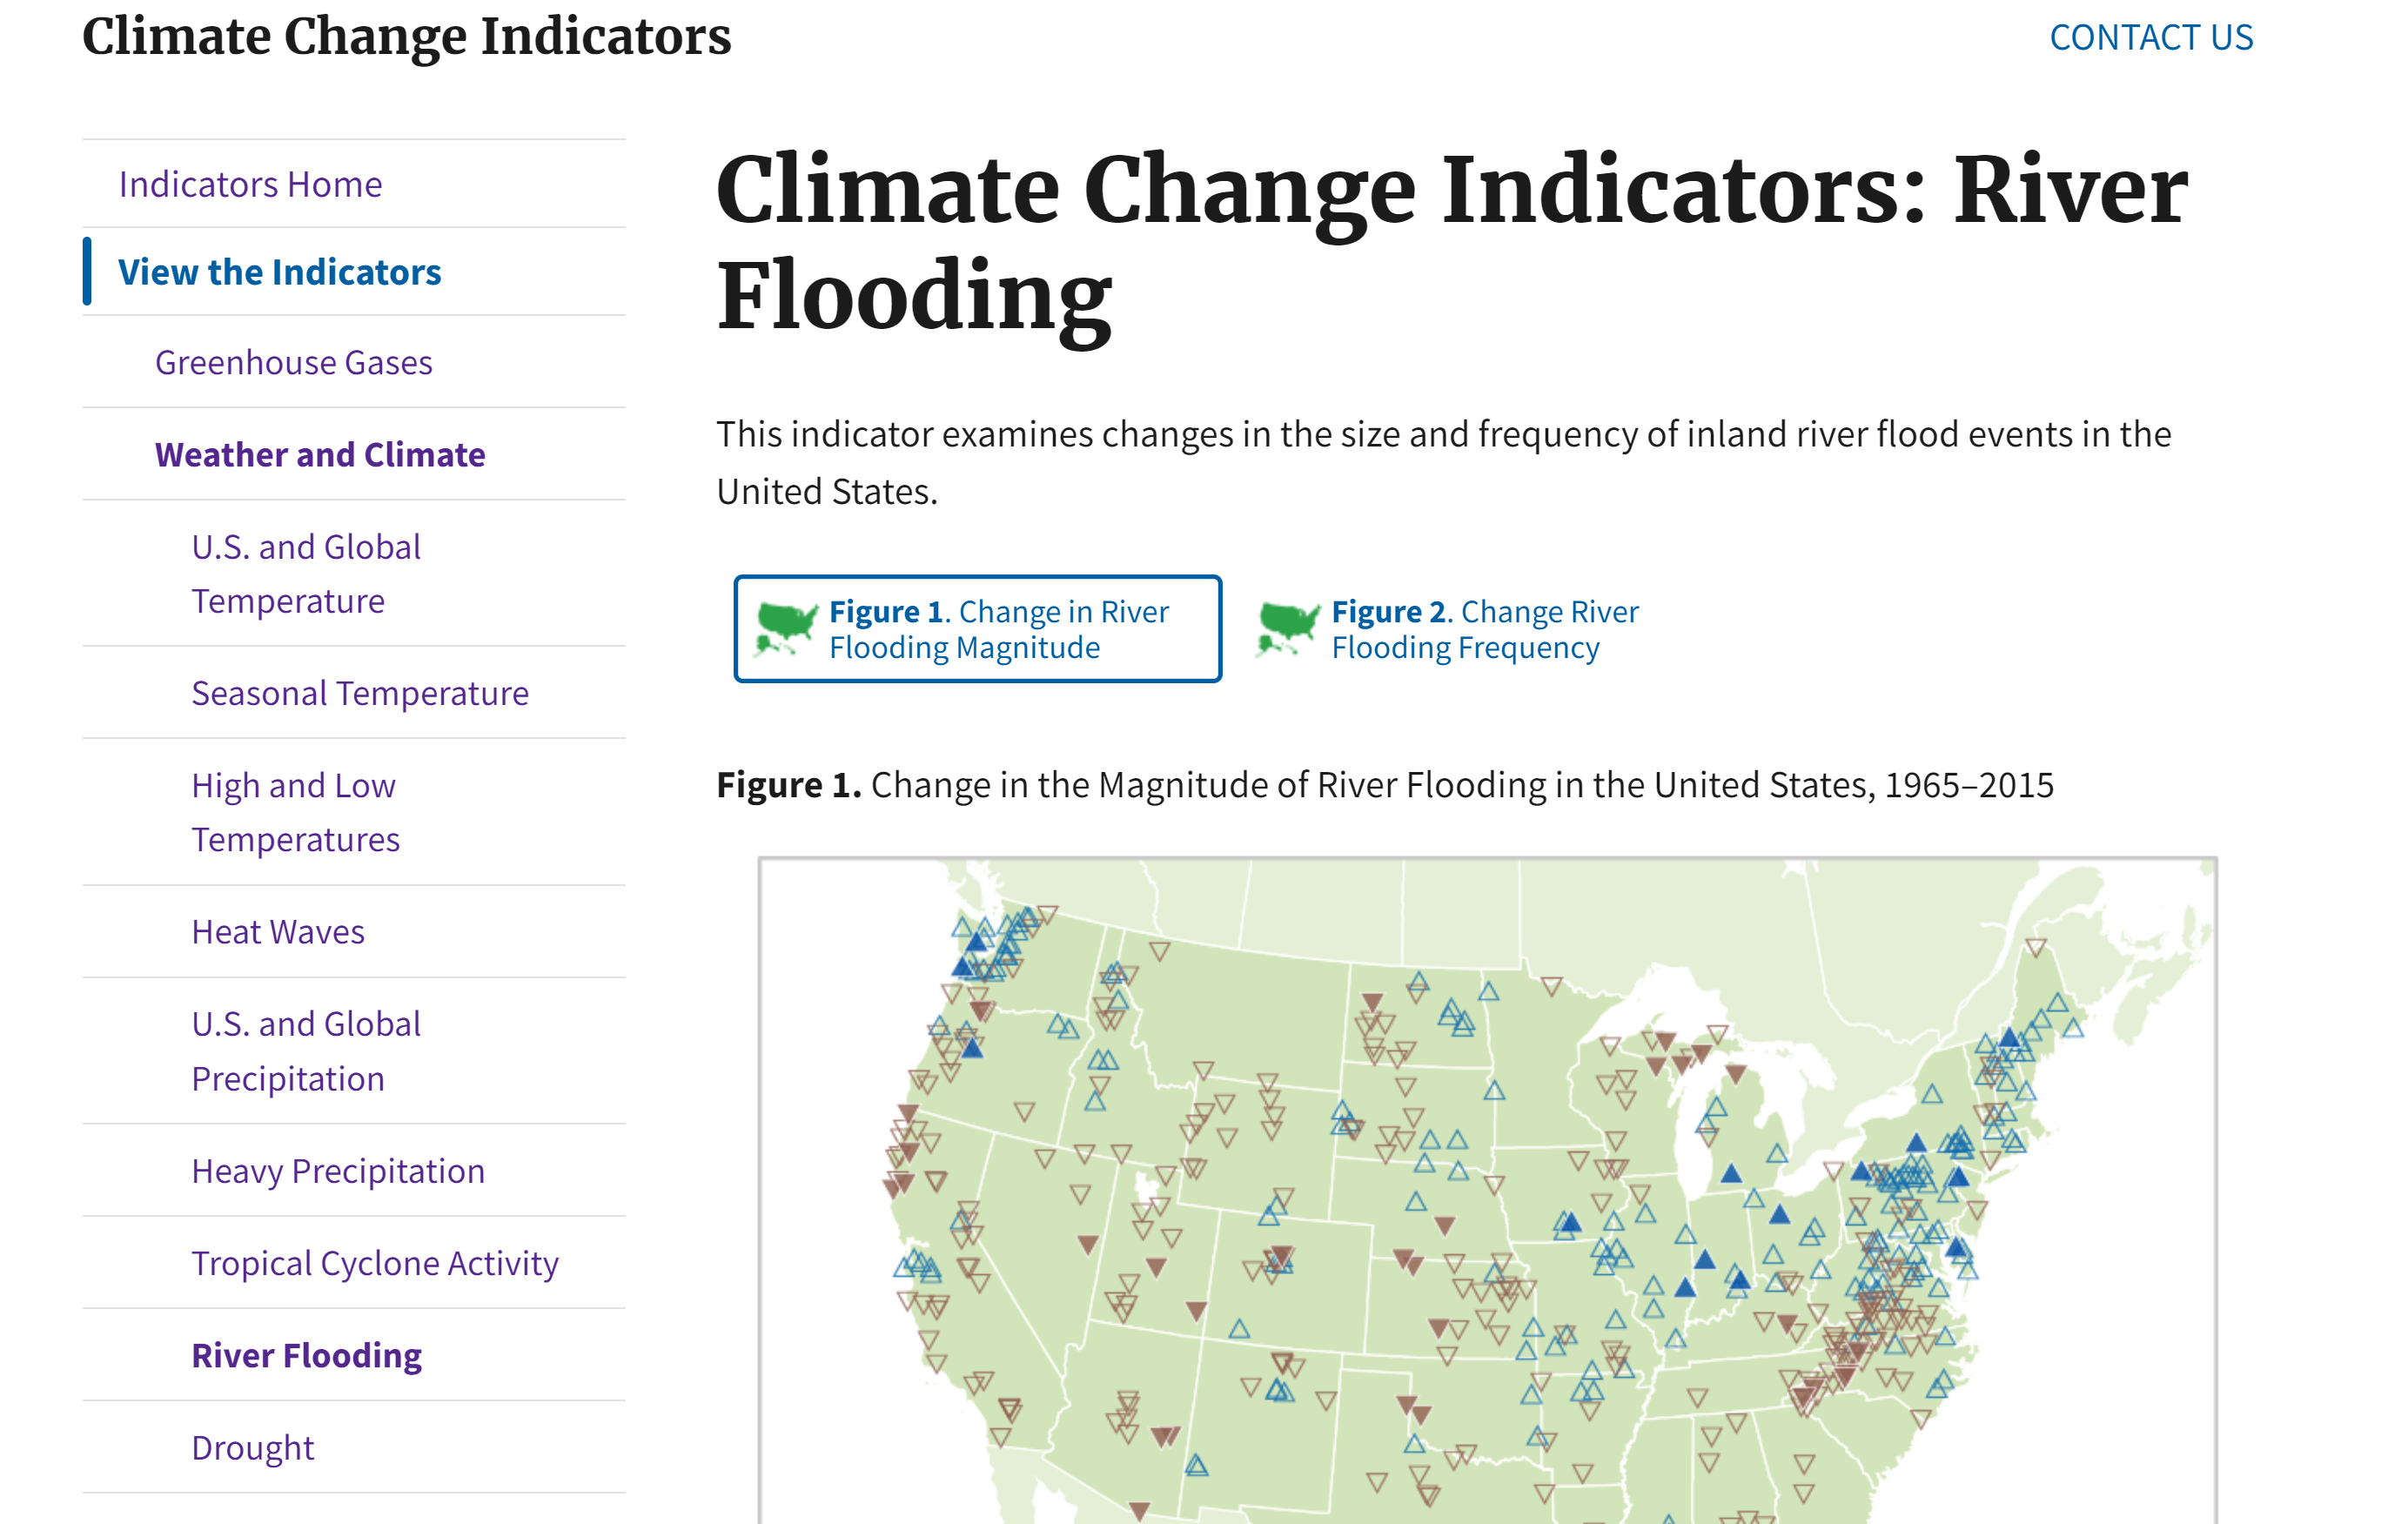
Bird Wintering Ranges Coastal Flooding Drought Freeze-Thaw Conditions Glaciers
Great Lakes Water Levels and Temperatures Heat-Related Deaths Heat-Related Illnesses Heating and Cooling Degree Days Heavy Precipitation High and Low Temperatures Ice Sheets Lake Ice Leaf and Bloom Dates Length of Growing Season Lyme Disease Marine Species Distribution Ocean Acidity Ocean Heat Permafrost Ragweed Pollen Season River Flooding Sea Ice - Antarctic Sea Ice - Arctic Sea Level Sea Surface Temperature Snow Cover Snowfall Snowpack Stream Temperature Streamflow Tropical Cyclone Activity U.S. and Global Precipitation U.S. and Global Temperature West Nile Virus Wildfires
Additional Resources
EXPERT/NGO ANALYSIS
- James Hansen Global Temperature Page
- Ed Hawkins Climate Visuals Page
- U.S. Actuaries Climate Index
- 2021 30 Years of Wildfires in America
- Roger Brugge's Inventory of Extreme Events 1994-2024
- Roger Brugge’s Inventory of 2024 Extreme Events
- 2018 Surface Temperature Anomalies 1850-2017
- Annual Heat Wave Index in the United States 1895-2015
- Number of recorded drought events
- Number of recorded natural disaster events
- Number of recorded natural disaster flood events 1900-2019
- Wildfire acres burned in the United States 1983-2017
NOAA GLOBAL MONITORING LABRATORY
- Monthly global CH4 last five years
- NOAA AGGI Annual Greenhouse Gas Index
- NOAA Global Monitoring Laboratory
ON-POINT INFOGRAPHICS