Other Temperature Visualizations
We’ve selected a number of temperature visualizations on this page, often excerpting a short video from a much longer one so you can get a quick sense of the idea. Note that they’re not necessarily up to date, so take them as examples of how different people have tried to help us visualizing temperature change, rather than as a report of what has happened to date.
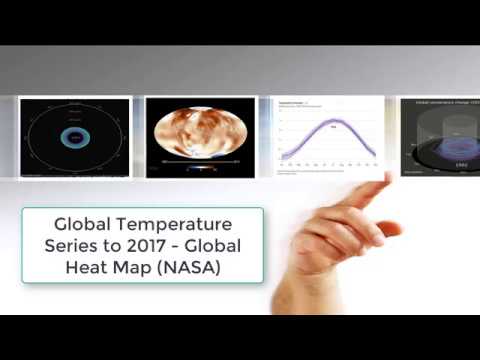
Heat maps like this one have been around for many years
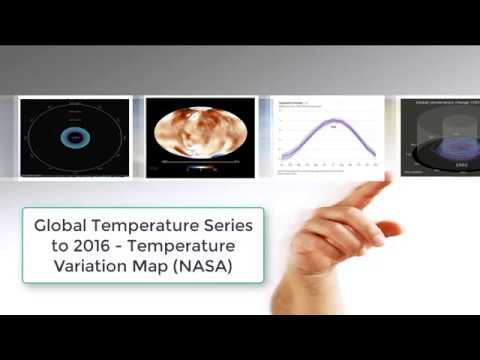
A different Heat Map approach showing temperature variations from the average over decades, allowing you quickly see "how colder than normal" temperatures have declined over time
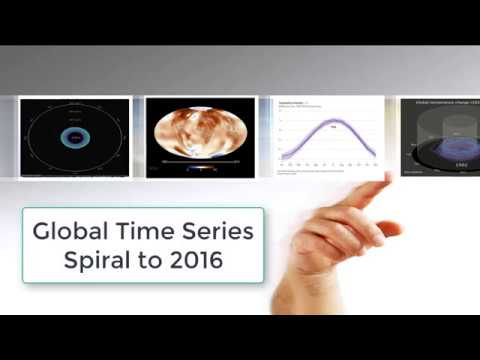
A spiral representation of average monthly global temperature change to date
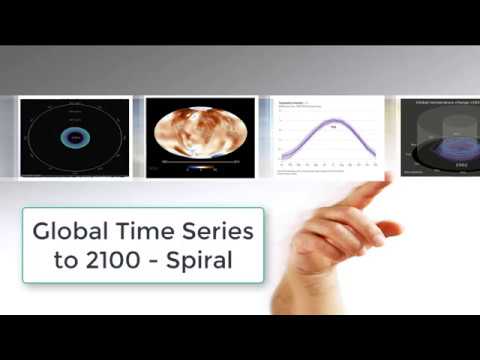
A spiral representation of forecasted average global temperature change to 2100
A 3-D version of the average global temperature spiral
A bar chart animation illustrates that while overall global temperature trends are clear, it's hardly a linear process
A month to month look at global temperature change, showing that there’s much more to the 12-month picture than just “average” change
And the picture gets more and more complex as you account for annual land vs. ocean changes, or annual variability by latitude
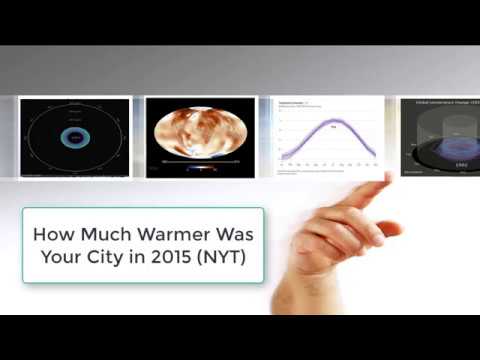
Or mapping temperature change at the local level
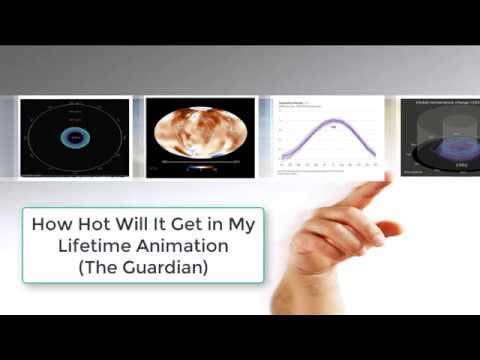
Or an interactive animation exploring explore how warm the world will get during your lifetime