The Visualization Challenge
The same challenges that make climate change hard to solve can make it hard to visualize:
- Average global temperature changing by hundredths of a degree per year
- Even projected average global temperature change seems dwarfed by daily or geographic variations in local temperature. Does a 2o C increase really matter?
- Sea levels rising by millimeters per year
For example, in the video below (right click on the image to see the video) you can observe average global temperature change using a typical thermometer.
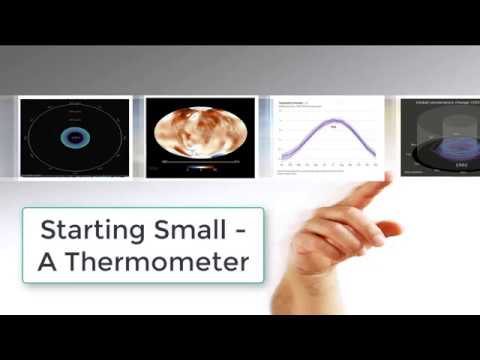
Yes, the thermometer is actually changing - you just can’t really see the change against the backdrop of the natural greenhouse effect, which keeps the Earth about 59o F warmer than it would be in the absence of an atmosphere. It’s not a particularly effective “call to action” to tackle climate warming, and it facilitates the “willful blindness” discussed by Margaret Heffernan in this great quote:
This Ebook pulls together interesting examples of efforts to come up with climate change animations that overcome the problem we’ve just pointed to. Most represent YouTube videos, some represent interactive animations, some represent widgets that can actually be embedded on your website.
Many of the animations included below are very short, ranging from 30 seconds to just over a minute. In some cases we've accelerated the original video to reduce the playing time. The animations included here are not necessarily the most recent examples of the different animations. Our goal is more to provide you with a flavor of what's available when it comes to climate change animations than to point you to the most recent data.
But we’ll start with a relatively recent addition to the climate visualization world, Climate Stripes.