Extreme Event Futures: Small Changes, Big Risks
Climate change is already shifting the probability distributions associated with many elements of the “fingerprint” of climate change. But how do those changing probabilities influence overall risk? That depends on the consequences.
When it comes to the impacts of climate change, particularly those located in the long tails of a probability distribution, the change in risk is not simply proportional to the change in probability. That’s because the consequences of the extremes are not linear. A 1,000 year flood, for example, is likely to be far more damaging than simply 10x the 100 year flood. If consequences rise exponentially rather than linearly, even seemingly modest changes in the probability distribution of such outcomes can have a very big impact on assessed risk.
Here we’ll look at a practical example combining the consequences of extreme events with the changing probabilities of extreme events. Economist Robert Repetto does a great job of explaining this in a 2010 paper in which explores hurricane risks facing New York City.
2010 Repetto_Climate Change and Extreme Weather
First, he estimates the changing "return periods" for different categories of hurricane based on a changing climate.
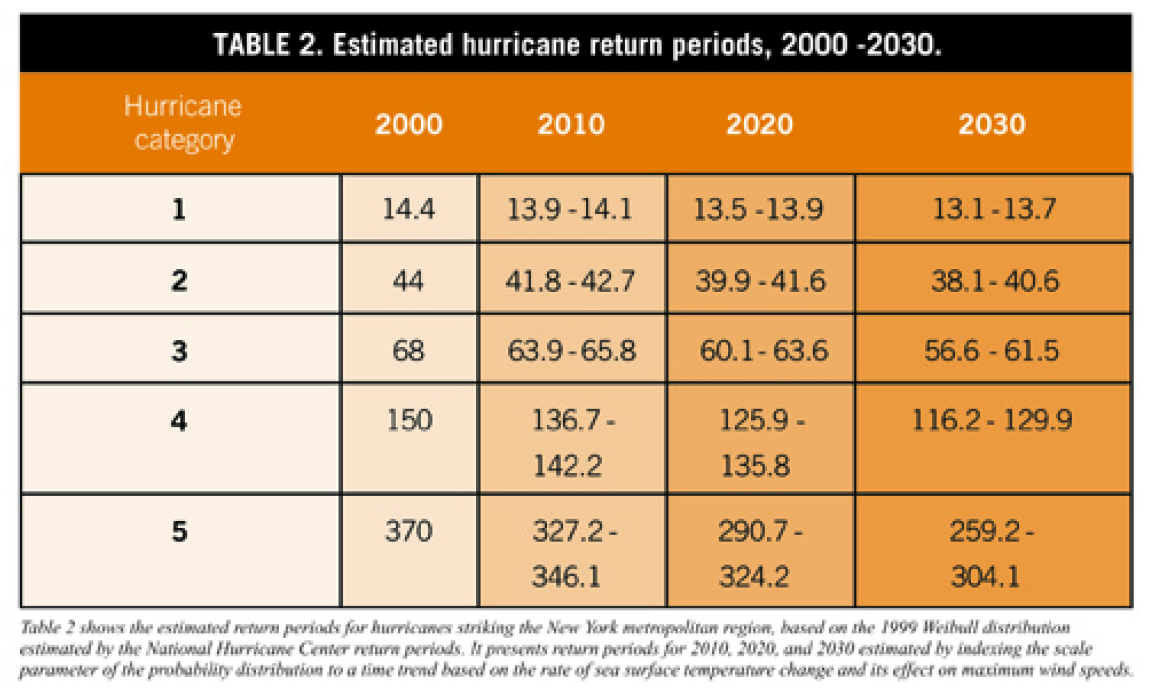
In the case of a Category 5 hurricane striking NYC, for example, the estimated return period goes from 370 years in 2000 to between 259-304 years in 2030, an increased annual likelihood of close to 25%.
That changing probability is then mapped against the economic costs of a hurricane strking NYC. Note that the changing probability is shown as an "exceedance curve," which is simply another way of displaying a probability distribution. The main point is that in 2030, any given level of damage has increased in annual probability as compared to 2000.
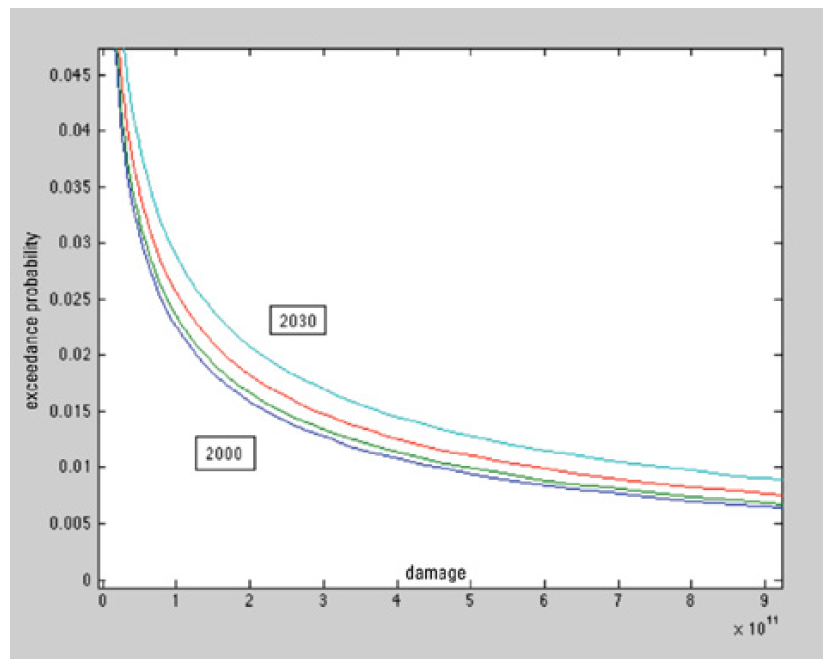
The change in probabilities as shown on the left axis may still seem quite low, but expected damages rise rapidly. As Repetto notes:
"One striking feature that is immediately apparent is that the exceedance curve is “fat-tailed”: probabilities decline slowly as heavy losses mount. As maximum wind speeds increase, damages mount very rapidly, offsetting the declining probability of the more intense storms. The probability of losses exceeding a trillion dollars is not half the probability of losses exceeding $500 billion, but substantially more than that. This illustrates how vulnerable to catastrophic hurricane damage the New York metropolitan region is now."
Repetto concludes his analysis with an estimate of the change in expected annual costs from hurricanes, and what New York City ought to be willing to pay in insurance premiums to manage the growing risk. The equivalent of 1/2 of the city’s 2009 budget!
"Another way of understanding the increasing economic risks is to ask how much the region should be willing to pay to insure against all hurricane damages, if such comprehensive insurance were available. Even without an aversion to catastrophic risks, the region should be willing to pay an annual insurance premium up to the expected value of losses in the absence of insurance. The expected value of losses is the sum of all possible hurricane losses, weighted by their probabilities of occurring. Because the loss exceedance curve is so “fat-tailed,” with significant probabilities of huge losses, that rational insurance premium, calculated using the outdated 2000 return periods estimated by the National Hurricane Center, is about $33 billion dollars per year. To put that amount in context, the entire 2009 expenditure budget of the City of New York is just over $60 billion. However, as the likelihood of hurricane damage rises, that insurance premium increases to $35–37 billion in 2010, $40–46 billion in 2020, and $47–62 billion in 2030. The ranges reflect the high and low estimates of the pace of sea surface temperature increase. In other words, the expected value of losses could nearly double over three decades, just because of the increasing likelihood of intense hurricanes. Unfortunately, the reality is even more disturbing. . . ."
One reason the reality is more disturbing is that hurricane risk is just one of MANY manifestations of climate change going forward. Doing a comprehensive analysis of the changing probabilities, associated consequences, and overall risk is a daunting task.
Climate Insights
- Climate Events Chronology
- The Risk of Extreme Sea Level Rise is Low , Right?
Dashboards
- Evaluating the Impacts of Climate Change on Tornadoes
- Impacts of Climate Change on Hurricanes
- Visualizing Climate Extremes
The Climate Web organizes an almost unlimited amount of climate information and knowledge. There is no single way to organize all that information, much less in a way that makes sense for everyone. That’s why the Climate Web is structured so that you can navigate its content in several ways, including via topical Insights Pages, Dashboards, Index Entries, and more. You can do all of that on-line, but it is MUCH easier and faster with the options described in the FAST ACCESS thought pinned to the top of your screen.