Average Global Temperature Increase
This is the climate fingerprint variable most often discussed in the media. Average global temperature is expected to rise over time with human-induced climate change, but there is no reason to expect a linear temperature progress from year to year because there is a lot of natural variability at work. Temperatures can also be measured at different heights in the atmosphere, and with different tools, creating different estimates of global temperature change at least in the near to mid-terms.
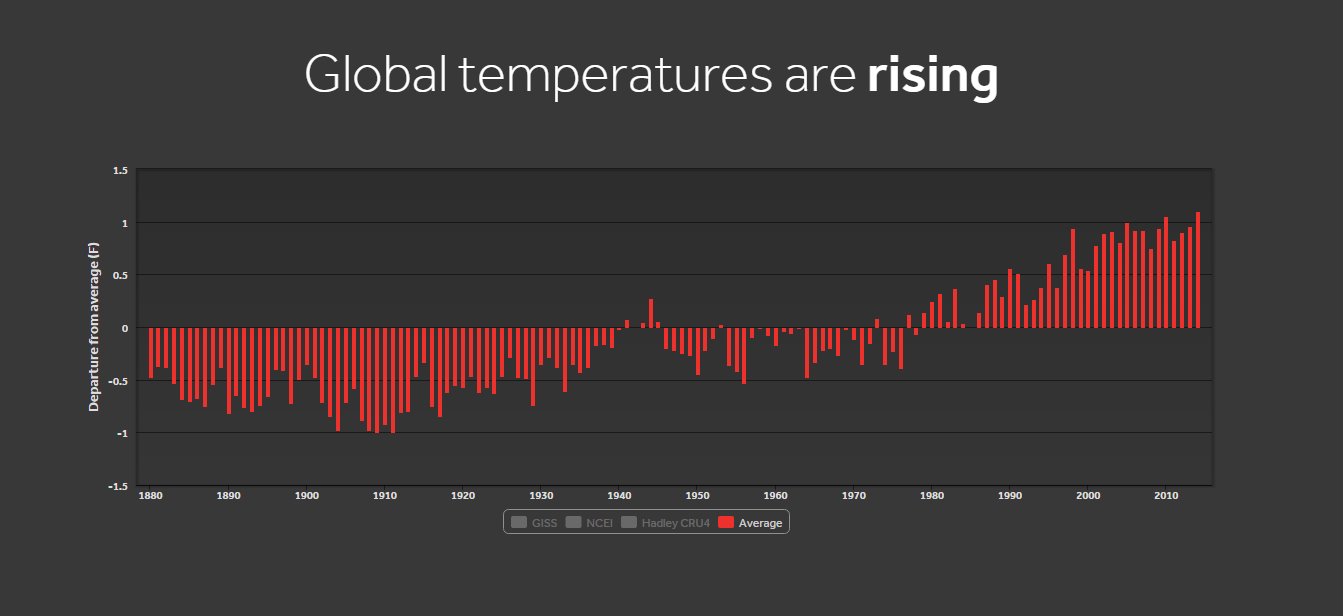
Scientists are confident that the global average temperature is rising (by about 0.7 degrees C so far this century) and that human activities are the cause. They estimate that increased greenhouse gas levels are trapping an amount of heat equivalent to the explosion of 4 Hiroshima atomic bombs every second.
One of the most famous graphics for illustrating the change in average global temperatures is the "stripes" graphic shown here.
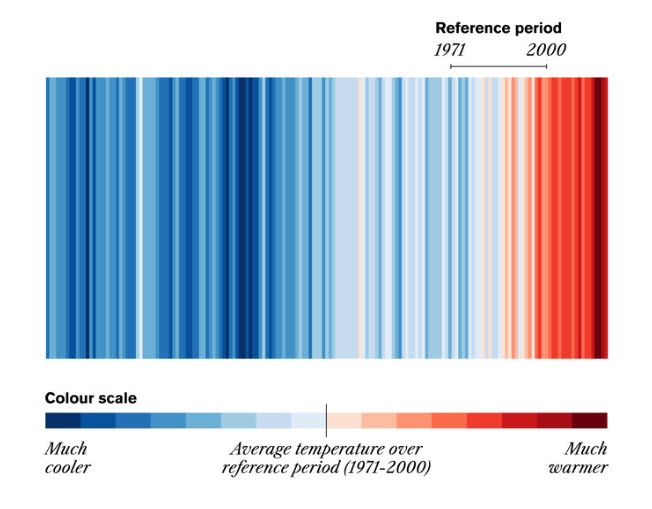
The stripes are based on the annual deviation from the average for the reference period around which the graphic is based. There are all kinds of stripes images being generated, including local change and future change. The stripes below, for example, show U.S. temperatures and precipitation.
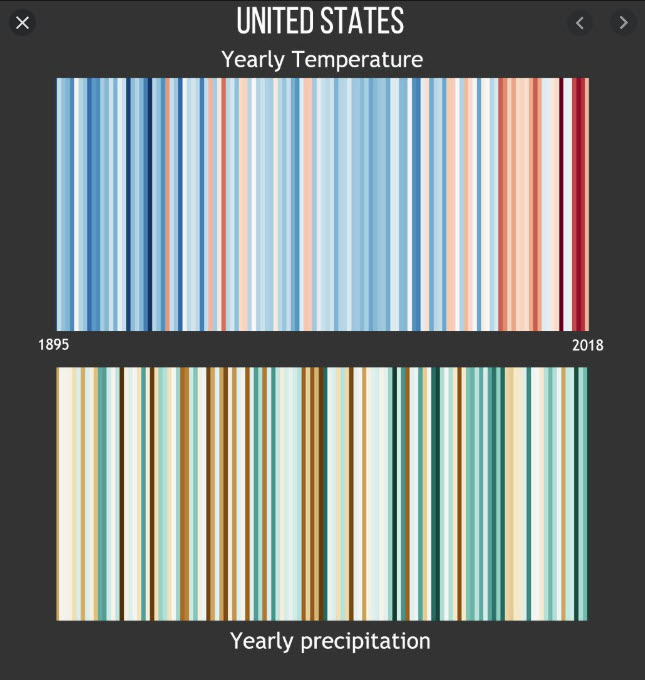
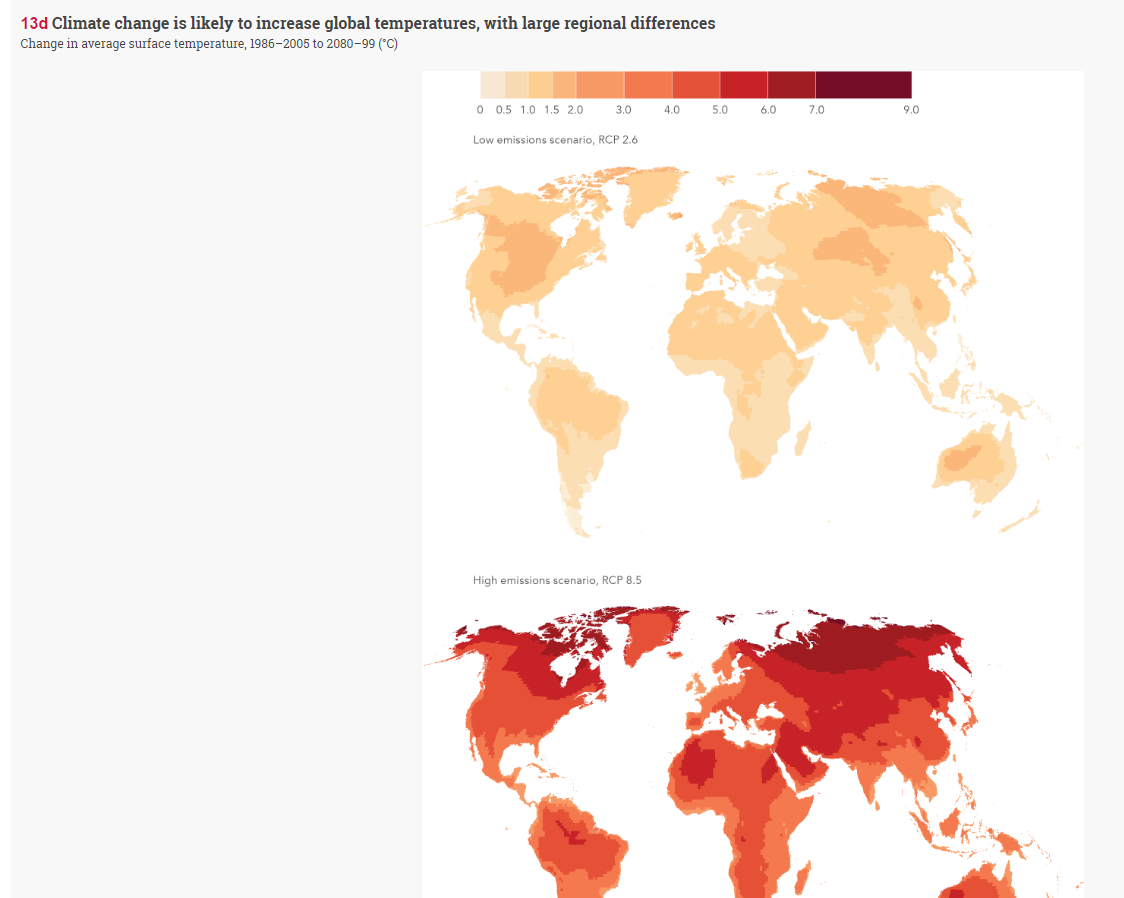
As you can see with the U.S. stripes above, temperatures in the U.S. don't match global temperature trends particularly well. That is indicative of the fact that regional temperature change is expected to vary widely over time, as shown in the image below for both the "best case" and "worst case" climate scenario. Extracted from "2017 World Bank_Atlas of Sustainable Development Goals." (available in the Climate Web)
Digging Deeper
Remember that green hyperlinks are available to Open Access as well as Premium Access users.
- Search the Internet - Average Global Temperature Change