PDF Output
Some of the easiest to absorb content in the paper is in the three graphics presented in the following pages.
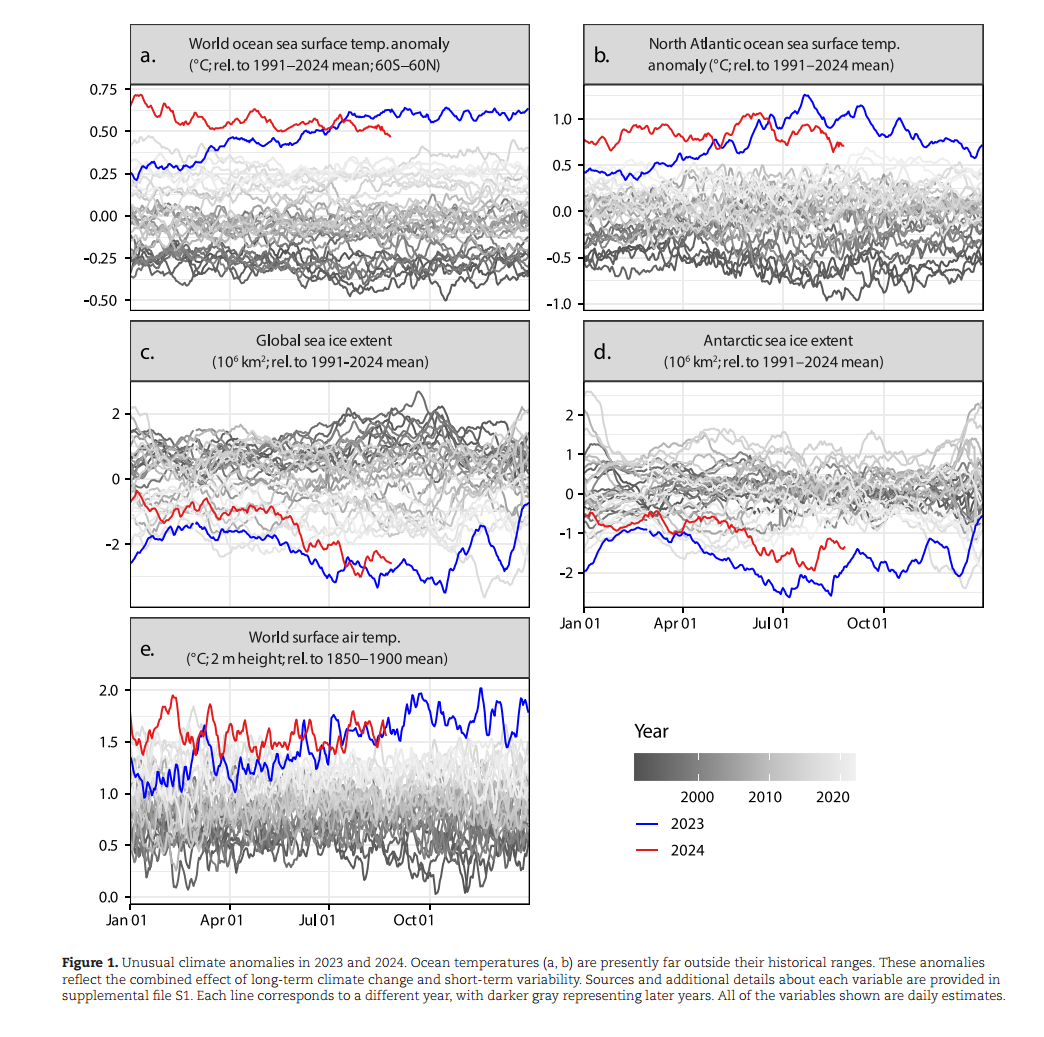
Illustration 1: Some of the anomalies of 2023 and 2024, including ocean temp, sea ice extent, and surface air temp. 2023 was quite the year, and 2024 isn’t much better. Could these two years turn out to be anomalies themselves? Sure, but the next two sets of illustrations make clear what long-term trends to expect.
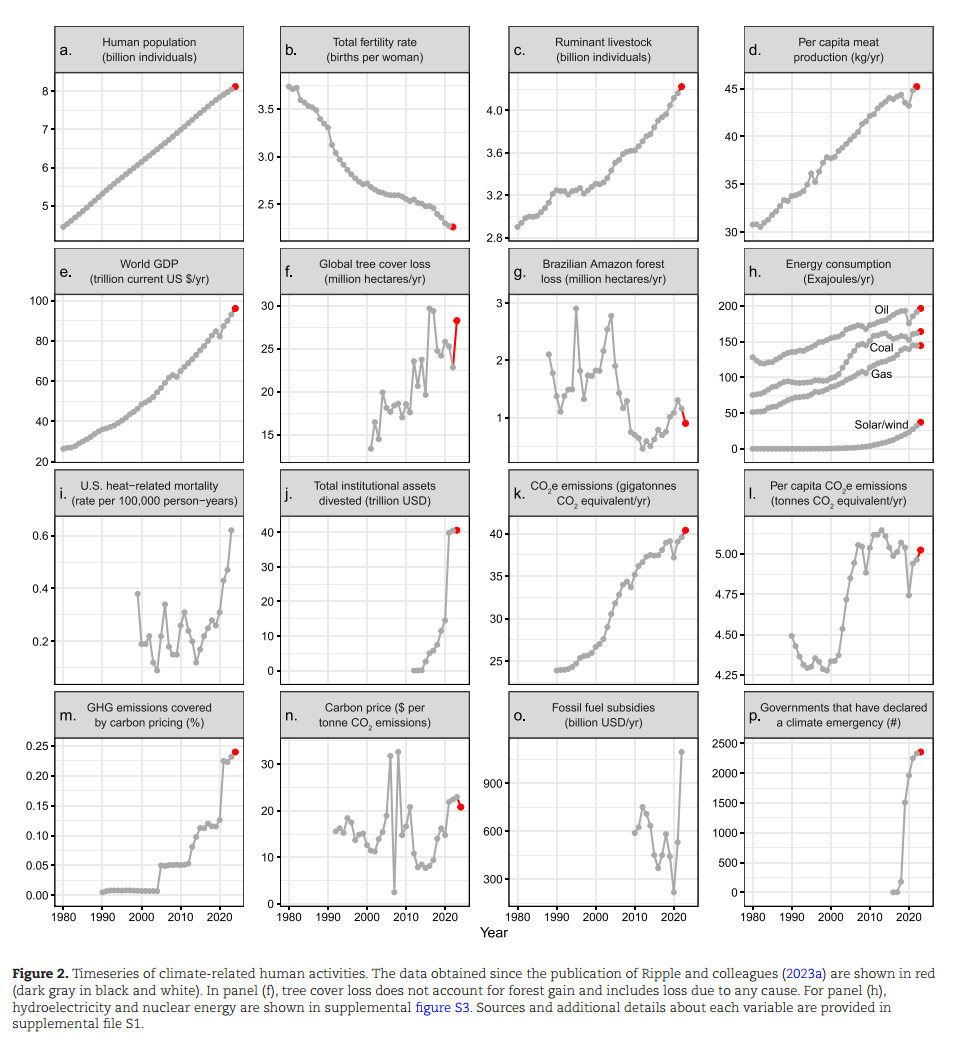
Illustration 2: Climate Drivers, from livestock numbers and forest loss to GHG emissions. Virtually every indicator continues to head in the wrong direction, and the few positive indicators, e.g. the reduction in Amazonian forest lost, could be temporary (it has been before!).
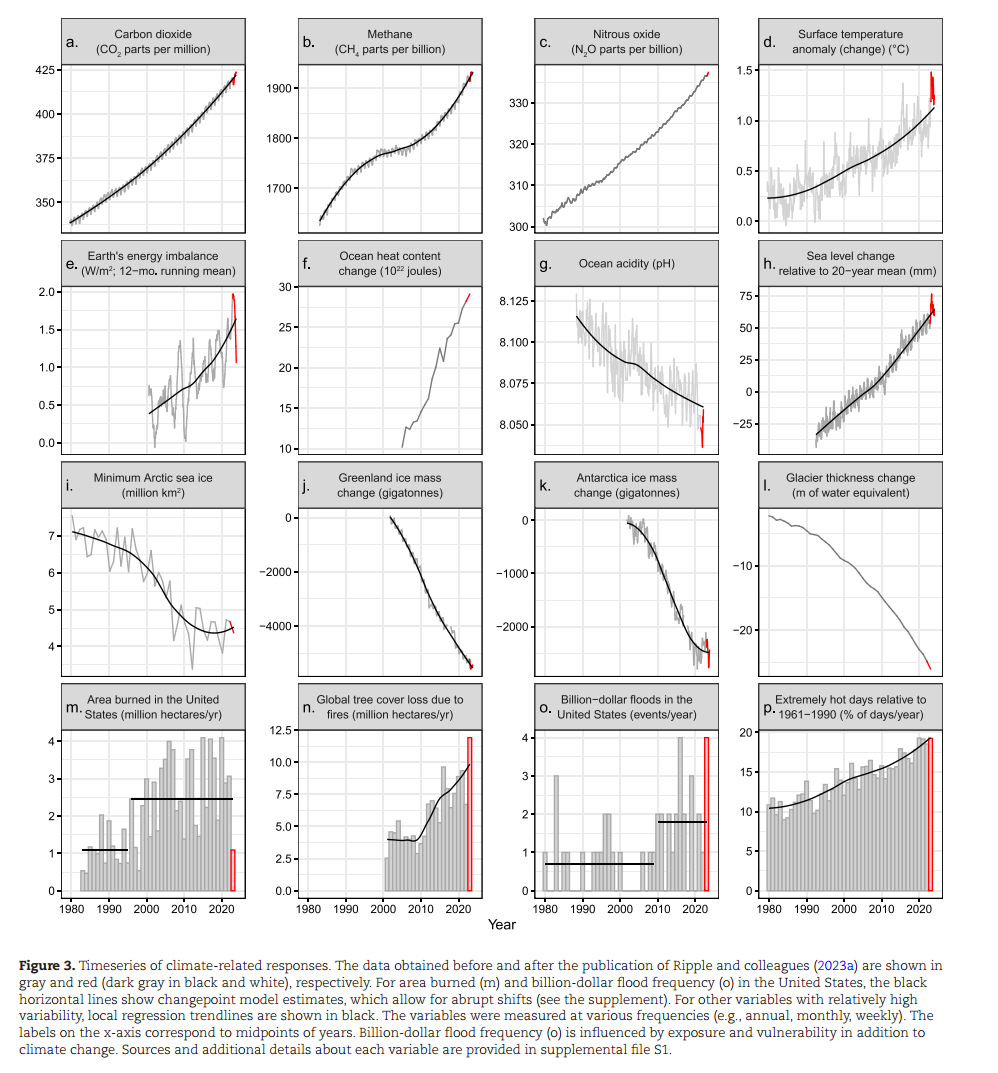
Illustration 3: Climate Fingerprint variables. There is a lot of year-to-year variability in many of these fingerprint variables, so the latest changes (in red) should be taken with a grain of salt in terms of long-term extrapolation.
The paper has a lot more content and graphics. If you download this PDF, you can download the paper itself here. 2024 Ripple_2024 State of the Planet Report Perilous times on planet earth.pdf
We’ve also used Google’s new NotebookLM technology to create a 12-minute podcast based on the report, aimed at a general audience. You can listen to it through this link: 2024 Ripple State of the Climate Report - Podcast NotebookLM.wav (It may have a problem is multiple people access it at the same time).