Other Climate Visualizations
This page points you to other relevant climate change visualizations.
What remains of the “Trillion Ton Carbon Budget,” commonly associated with a 2o C target?
An alternative visualization of the "Trillion Ton Budget," emulating the famous national debt counter. Note that it is based on carbon rather carbon dioxide emissions
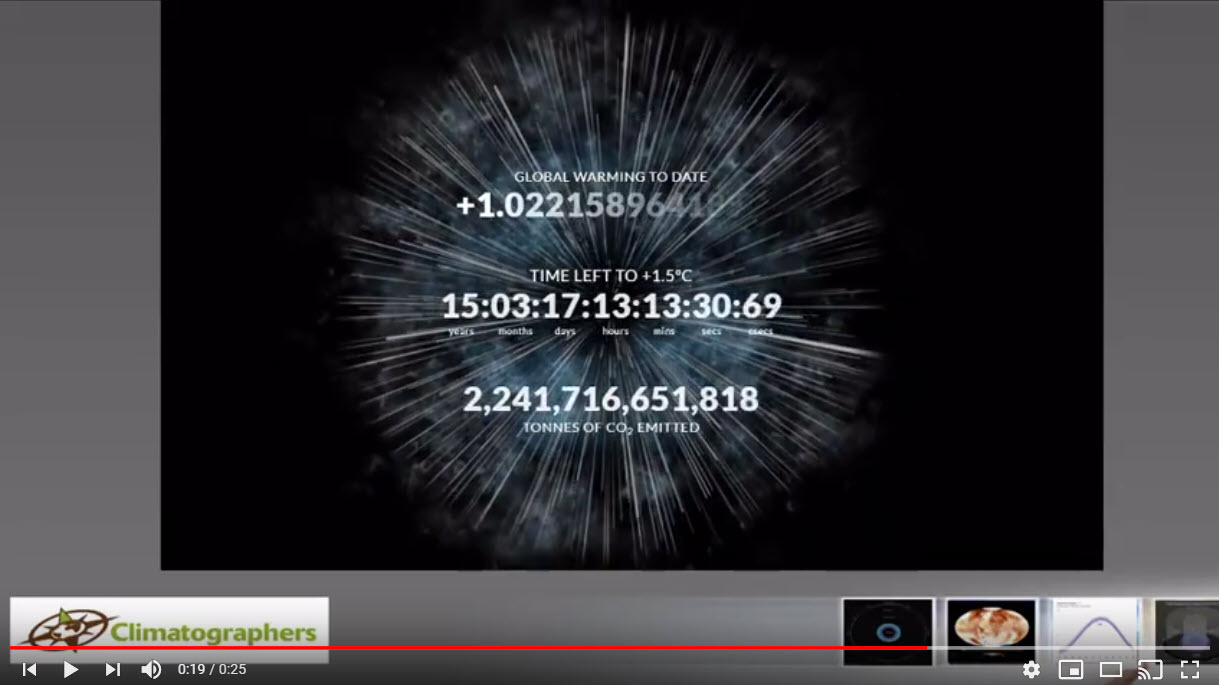
The well-known Climate Clock, counting down to hitting the 1.5 degrees C target. In this case the emissions are expressed as tons of carbon dioxide

One of our favorite animations because it expresses changes to the atmosphere in terms that might be easier to emotionally internalize than "tons" and "average global temperatures"