SkepticalScience
confirms oreskes 97%
Earlier this month, John Cook of Skeptical Scienceand his team of volunteers at the Consensus Project released the latest definitive study of global warming scientific consensus, revealing that 97 percent of peer-reviewed papers with a clear view on the subject agree that global warming is occurring and that humans are the primary cause.
Ever since, we've seen the predictable pushback from fossil fuel industry apologists and climate deniers.
The loudest response comes from the Alberta-based Friends of Science, a shadowy non-profit with a history of Canadian oil company ties, which DeSmogBlog has covered extensively over the years.
Read more: Enemies of Science Want to Confuse You About The 97-Percent Consensus Study
http://www.desmogblog.com/directory/vocabulary/5910
===
nerdy!
detailed look at Hansen's 1988 projections
Posted on 20 September 2010 by dana1981

:{Hansen et al. (1988):(style="border-bottom:#004440;"):}: used a global climate model to simulate the impact of variations in atmospheric greenhouse gases and aerosols on the global climate. Unable to predict future human greenhouse gas emissions or model every single possibility, Hansen chose 3 scenarios to model. Scenario A assumed continued exponential greenhouse gas growth. Scenario B assumed a reduced linear rate of growth, and Scenario C assumed a rapid decline in greenhouse gas emissions around the year 2000.
Misrepresentations of Hansen's Projections
The 'Hansen was wrong' myth originated from testimony by scientist Pat Michaels before US House of Representatives in which he claimed "Ground-based temperatures from the IPCC show a rise of 0.11°C, or more than four times less than Hansen predicted....The forecast made in 1988 was an astounding failure."
This is an astonishingly false statement to make, particularly before the US Congress. It was also reproduced in Michael Crichton's science fiction novel *State of Fear*, which featured a scientist claiming that Hansen's 1988 projections were "overestimated by 300 percent."
Compare the figure Michaels produced to make this claim (Figure 1) to the corresponding figure taken directly out of Hansen's 1988 study (Figure 2).
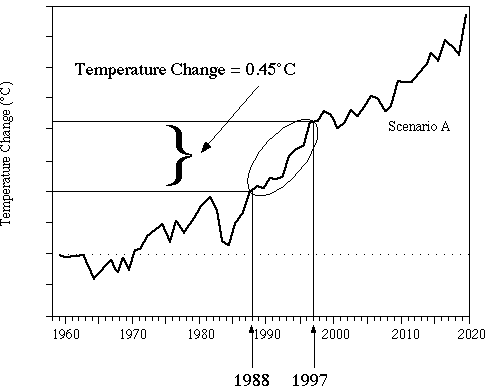
Figure 1: Pat Michaels' presentation of Hansen's projections before US Congress
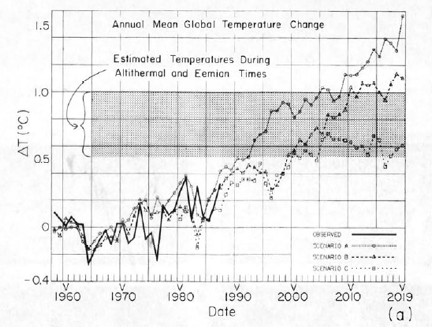
Figure 2: Projected global surface air temperature changes in Scenarios A, B, and C (Hansen 1988)
Notice that Michaels erased Hansen's Scenarios B and C despite the fact that as discussed above, Scenario A assumed continued exponential greenhouse gas growth, which did not occur. In other words, to support the claim that Hansen's projections were "an astounding failure," Michaels only showed the projection which was based on the emissions scenariowhich was furthest from reality.
Gavin Schmidt provides a comparison between all three scenarios and actual global surface temperature changes in Figure 3.
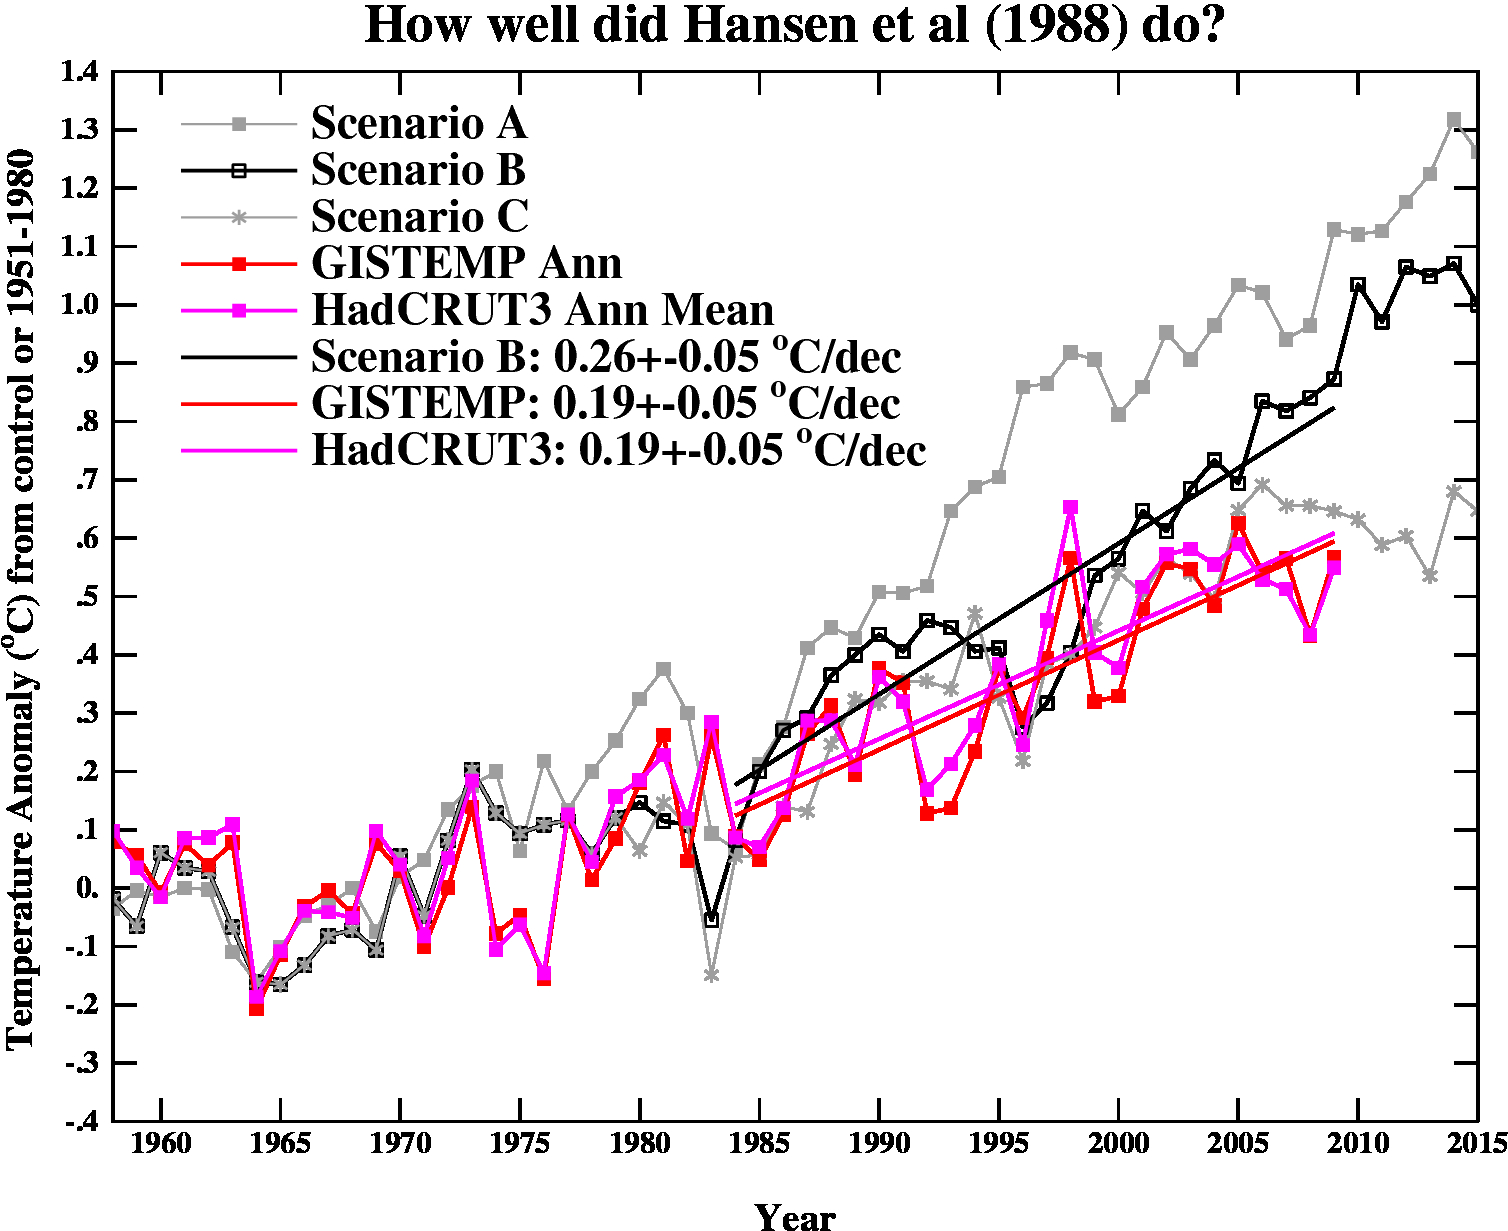
Figure 3: Hansen's projected vs. observed global temperature changes (Schmidt 2009)
As you can see, Hansen's projections showed slightly more warming than reality, but clearly they were neither off by a factor of 4, nor were they "an astounding failure" by any reasonably honest assessment. Yet a common reaction to Hansen's 1988 projections is "he overestimated the rate of warming, therefore Hansen was wrong." In fact, when skeptical climate scientist John Christy blogged about Hansen's 1988 study, his entire conclusion was "The result suggests the old NASA GCM was considerably more sensitive to GHGs than is the real atmosphere." Christy didn't even bother to examine why the global climate model was too sensitive or what that tells us. If the model was too sensitive, then what was its climate sensitivity?
This is obviously an oversimplified conclusion, and it's important to examine why Hansen's projections didn't match up with the actual surface temperature change. That's what we'll do here.
Hansen's Assumptions
Greenhouse Gas Changes and Radiative Forcing
Hansen's Scenario B has been the closest to the actual greenhouse gas emissions changes. Scenario B assumes that the rate of increasing atmospheric CO2 and methaneincrease by 1.5% per year in the 1980s, 1% per year in the 1990s, 0.5% per year in the 2000s, and flattens out (at a 1.9 ppmv per year increase for CO2) in the 2010s. The rate of increase of CCl3F and CCl2F2 increase by 3% in the '80s, 2% in the '90s, 1% in the '00s, and flatten out in the 2010s.
Gavin Schmidt helpfully provides the annual atmospheric concentration of these and other compounds in Hansen's Scenarios. The projected concentrations in 1984 and 2010 in Scenario B (in parts per million or billion by volume [ppmv and ppbv]) are shown in Table 1.
Table 1: Scenario B greenhouse gas (GHG) concentration in 1984, as projected by Hansen's Scenario B in 2010, and actual concentration in 2010
| GHG | 1984 | Scen. B 2010 | Actual 2010 |
|---|---|---|---|
| CO2 | 344 ppmv | 389 ppmv | 392 ppmv |
| N2O | 304 ppbv | 329 ppbv | 323 ppbv |
| CH4 | 1750 ppbv | 2220 ppbv | 1788 ppbv |
| CCl3F | 0.22 ppbv | 0.54 ppbv | 0.24 ppbv |
| CCl2F2 | .038 ppbv | 0.94 ppbv | 0.54 ppbv |
We can then calculate the radiative forcings for these greenhouse gas concentration changes, based on the formulas from Myhre et al. (1998).
dF(CO2) = 5.35*ln(389.1/343.8) = 0.662 W/m2
dF(N2O) = 0.12*( N - N0) - (f(M~0,N) - f(M0,N0))
= 0.12*(329 - 304) - 0.47*(ln[1+2.01x10⁻⁵ (1750*329)0.75+5.31x10⁻¹⁵ 1750(1750*329)1.52]-ln[1+2.01x10⁻⁵ (1750*304)0.75+5.31x10⁻¹⁵ 1750(1750*304)1.52]) = 0.022 W/m2
dF(CH4) =0.036*(M - M0) - (f(M,N0) - f(M0,N0))
= 0.036*(2220 - 1750) - 0.47*(ln[1+2.01x10⁻⁵ (2220*304)0.75+5.31x10-152220(2220*304)1.52]-ln[1+2.01x10⁻⁵ (1750*304)0.75+5.31x10⁻¹⁵ 1750(1750*304)1.52]) =0.16 W/m2
dF(CCl3F) = 0.25*(0.541-0.221) = 0.080 W/m2
dF(CCl2F2) = 0.32*(0.937-0.378) = 0.18 W/m2
Total Scenario B greenhouse gas radiative forcing from 1984 to 2010 = 1.1 W/m2
The actual greenhouse gas forcing from 1984 to 2010 was approximately 1.06 W/m2 (:{NASA}::{GISS}:). Thus the greenhouse gas radiative forcing in Scenario B was too high by about 5%.
Climate Sensitivity
:{Climate sensitivity:(style="border-bottom:#004440;"):}: describes how sensitive the global climate is to a change in the amount of energy reaching the Earth's surface and lower atmosphere (a.k.a. a radiative forcing). Hansen's climate model had a global mean surface air equilibrium sensitivity of 4.2°C warming for a doubling of atmospheric CO2 [2xCO2]. The relationship between a change in global surface temperature (dT), climate sensitivity (λ), and radiative forcing (dF), is
dT = λ*dF
Knowing that the actual radiative forcing was slightly lower than Hansen's Scenario B, and knowing the subsequent global surface temperature change, we can estimate what the actual climate sensitivity value would have to be for Hansen's climate model to accurately project the average temperature change.
:{:(style="background-color:#ffffff;"):}:
Actual Climate Sensitivity
...goes on and on ;)
===
related dutch site
Scott Denning is a climate scientist and professor of atmospheric science at Colorado State University. He is known for his research into atmosphere-biosphere interactions and atmospheric carbon dioxide.
He has also, on occasion, gone to Heartland Institute conference to defend the scientific consensus on global warming. In this interview he shares his story and experiences of going to these Heartland Institute conferences and tackling climate science denial head on.
Sources
- Scott Denning v. Roy Spencer Debate ICCC6
- Scott Denning ICCC6
- Scott Denning ICCC4
- Scott Denning Speaks at International Conference on Climate Change
Media resources
Interviews filmed in collaboration with University of Queensland and Skeptical Science. Full interviews available April 2015 in ‘Making Sense of Climate Science Denial‘.
Camera B interview footage provided by Peter Sinclair of Climate Denial Crock of the Week and Yale Climate Connections.
==