Doji pattern
Summary: Doji Pattern
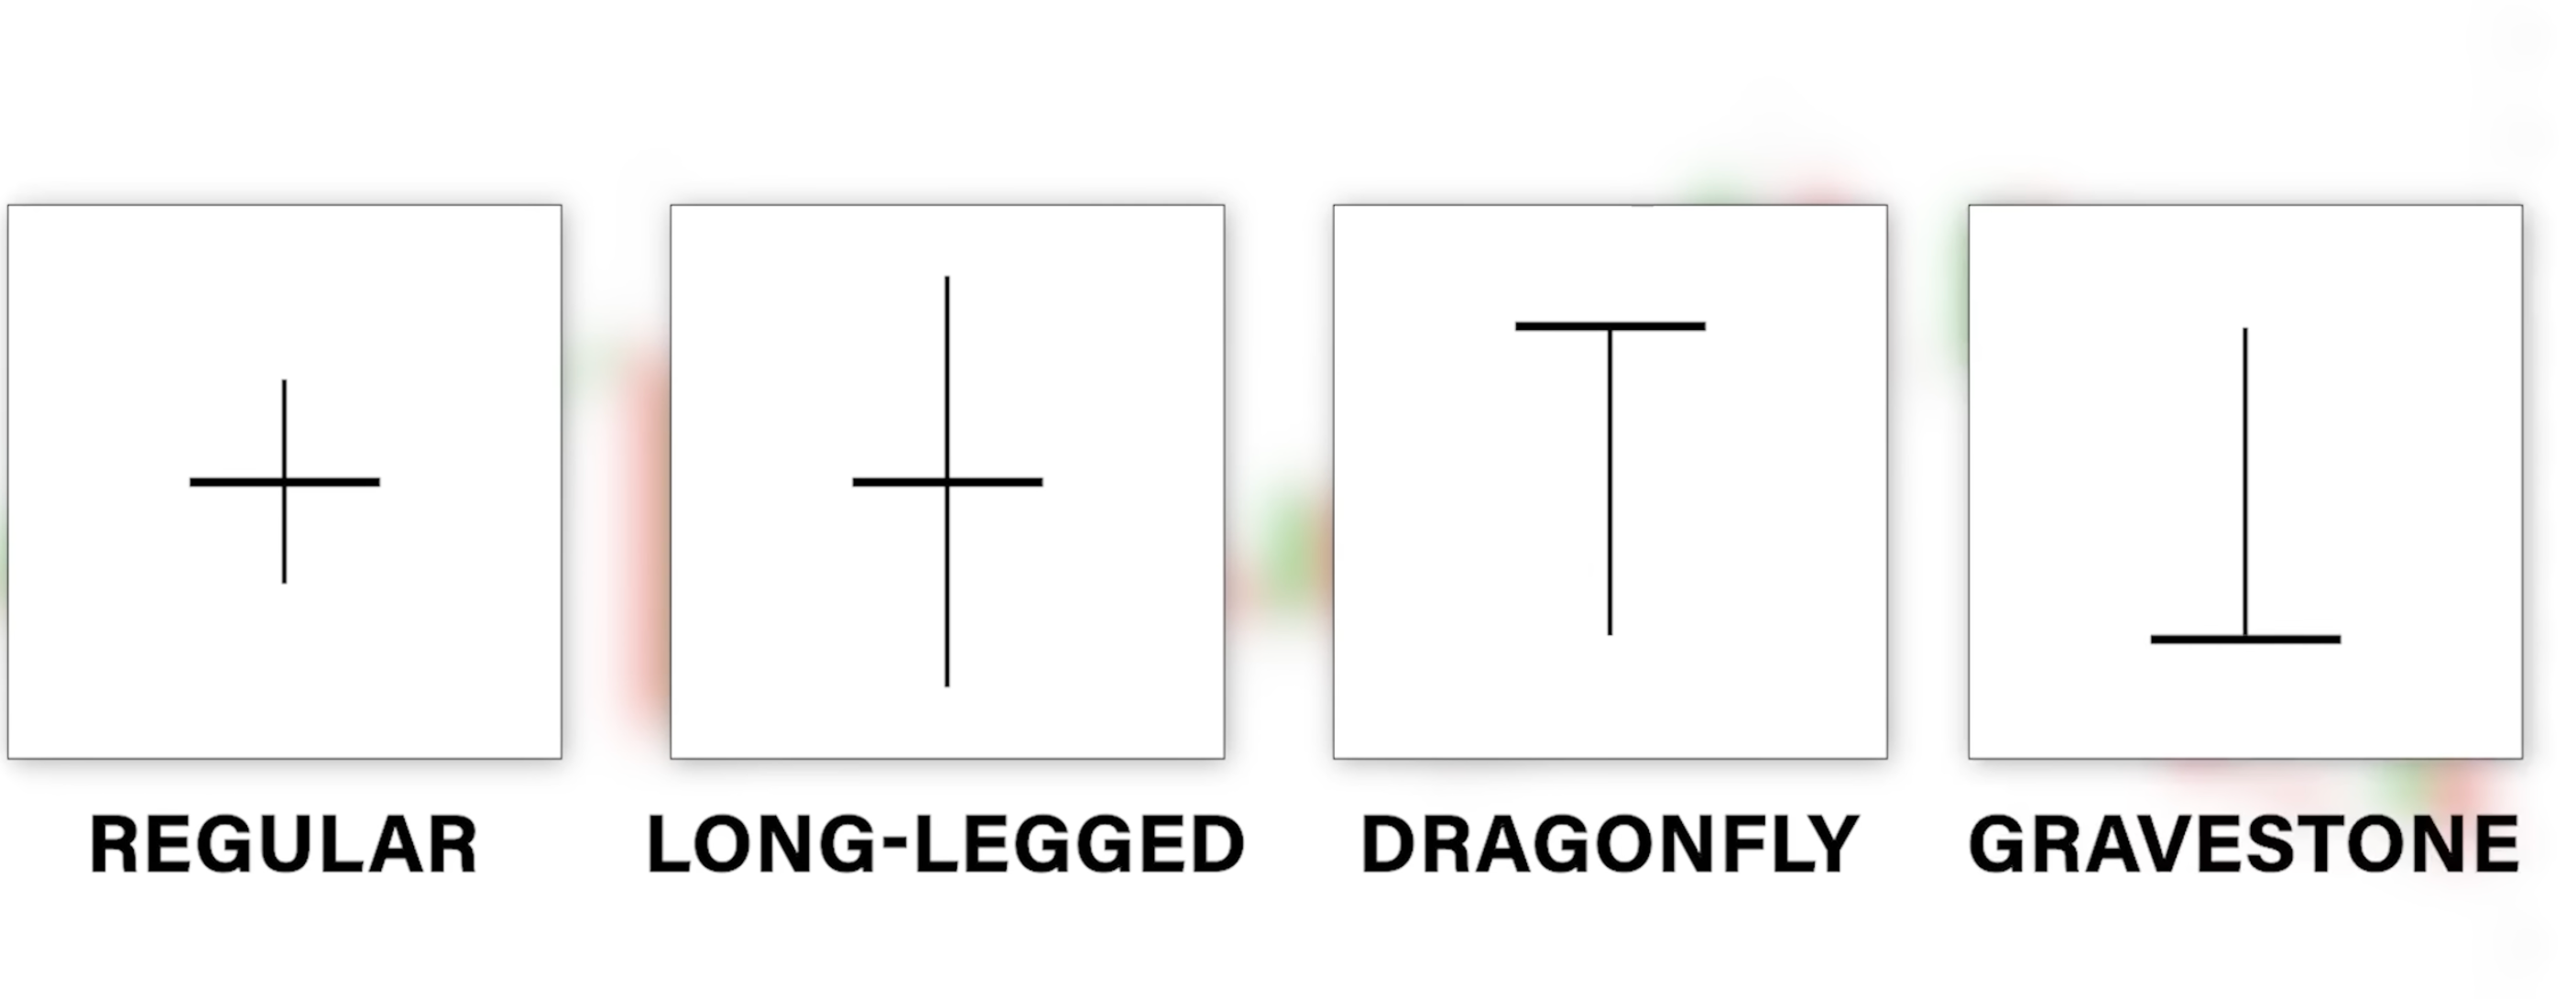
The Doji pattern is a candlestick pattern commonly used in technical analysis to analyze and predict price movements in financial markets. It is formed when the opening and closing prices of an asset are very close or even equal, resulting in a small or non-existent body with long upper and lower shadows.
The Doji pattern suggests indecision in the market, as it represents a tug-of-war between buyers and sellers. This pattern is particularly significant when it occurs after a strong price movement, as it indicates a potential reversal or a change in the prevailing trend.
Key characteristics of the Doji pattern include:
- Small or non-existent body: The body of the candlestick is very small or non-existent, indicating that the opening and closing prices are very close or equal.
- Long upper and lower shadows: The upper and lower shadows, also known as wicks or tails, are significantly longer than the body. These shadows represent the range between the highest and lowest traded prices during the time period.
There are several variations of the Doji pattern, each with slightly different implications for traders:
- Standard Doji: The opening and closing prices are virtually identical, resulting in a very small or non-existent body. This pattern suggests a possible trend reversal, especially when it occurs after a prolonged uptrend or downtrend.
- Long-legged Doji: The Doji pattern with long upper and lower shadows, indicating greater indecision in the market. This pattern often occurs during periods of high volatility and can signal a potential trend reversal.
- Dragonfly Doji: This pattern occurs when the opening and closing prices are at the high of the trading session, with no upper shadow and a long lower shadow. It suggests a potential bullish reversal, especially when it appears after a downtrend.
- Gravestone Doji: The opposite of the Dragonfly Doji, the Gravestone Doji has no lower shadow and a long upper shadow. It occurs when the opening and closing prices are at the low of the trading session and often suggests a potential bearish reversal after an uptrend.
The interpretation of the Doji pattern is subjective and requires additional confirmation from other technical indicators or price action analysis. Traders often look for confirmation through the following factors:
- Volume: Analyzing trading volume during the formation of the Doji pattern can provide further insight into the strength of the potential reversal.
- Support and resistance levels: Identifying key support and resistance levels near the Doji pattern can help confirm the potential reversal.
- Confirmation candlestick: Waiting for a subsequent candlestick to close in the direction opposite to the prevailing trend can provide additional confirmation.
It is important to note that the Doji pattern is not infallible and should not be relied upon solely for trading decisions. Traders should consider it as one piece of the puzzle and incorporate it into a comprehensive trading strategy.
In conclusion, the Doji pattern is a widely recognized candlestick pattern used in technical analysis to signal potential trend reversals. Its formation indicates indecision in the market, and traders often seek confirmation from other indicators before making trading decisions.