Sensitivity vs Specificity
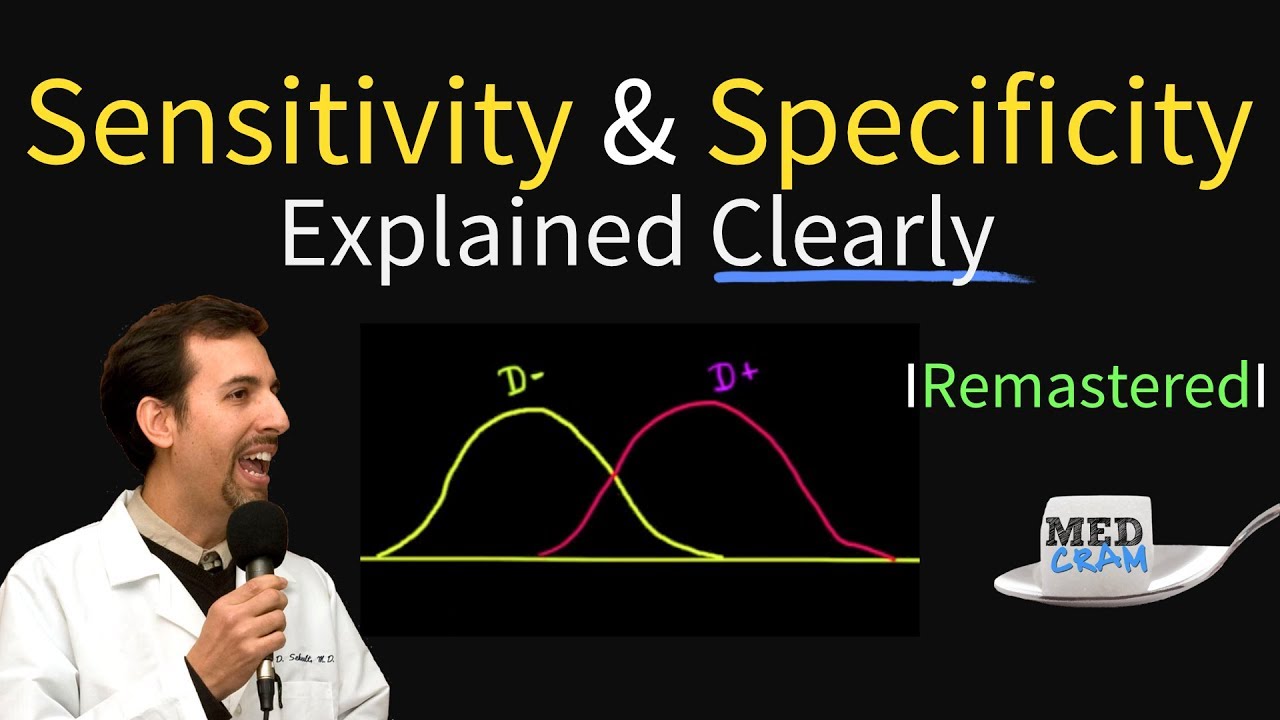
In the realm of diagnostic testing, particularly in medical and scientific fields, the terms sensitivity and specificity are crucial for evaluating the performance of a test. These metrics help determine how well a test can identify true positives and true negatives, respectively.
SENSITIVITY
Sensitivity refers to a test's ability to correctly identify those with the condition (true positives). It is the proportion of actual positives that are correctly identified by the test. A highly sensitive test means that there are few false negatives, which are cases where the test fails to identify a condition that is present.
Formula for Sensitivity
The formula for calculating sensitivity is:
Sensitivity = (True Positives) / (True Positives + False Negatives)Importance of Sensitivity
- Early Detection: High sensitivity is crucial for early detection of diseases, especially in conditions where early intervention can significantly alter the outcome.
- Screening Tests: Sensitivity is particularly important in screening tests where the goal is to identify as many cases as possible, even at the risk of some false positives.
Example
Consider a test for a disease that has a sensitivity of 90%. This means that 90% of those who have the disease will test positive, while 10% will test negative despite having the disease.
Specificity
Specificity refers to a test's ability to correctly identify those without the condition (true negatives). It is the proportion of actual negatives that are correctly identified by the test. A highly specific test means that there are few false positives, which are cases where the test incorrectly identifies a condition that is not present.
Formula for Specificity
The formula for calculating specificity is:
Specificity = (True Negatives) / (True Negatives + False Positives)Importance of Specificity
- Confirmatory Tests: High specificity is important in confirmatory tests where the goal is to ensure that those identified as having the condition truly have it.
- Avoiding Unnecessary Treatment: Specificity is crucial in avoiding unnecessary treatments and the anxiety associated with false positive results.
Example
Consider a test for a disease that has a specificity of 95%. This means that 95% of those who do not have the disease will test negative, while 5% will test positive despite not having the disease.
Balancing Sensitivity and Specificity
In practice, there is often a trade-off between sensitivity and specificity. Increasing sensitivity may lead to a decrease in specificity and vice versa. The balance between these two metrics depends on the context and purpose of the test.
Factors Influencing the Balance
- Disease Prevalence: In diseases with high prevalence, sensitivity might be prioritized to ensure cases are not missed. In contrast, for rare diseases, specificity might be prioritized to avoid false positives.
- Consequences of Errors: The consequences of false positives and false negatives can influence the balance. For instance, in life-threatening conditions, missing a diagnosis (false negative) might be more critical than a false positive.
Receiver Operating Characteristic (ROC) Curve
The ROC curve is a graphical representation that illustrates the trade-off between sensitivity and specificity across different thresholds. The area under the ROC curve (AUC) provides a single measure of overall test performance. A test with an AUC close to 1 indicates excellent performance.
Practical Applications
Understanding sensitivity and specificity is vital in various fields:
- Medical Diagnostics: In medical diagnostics, these metrics help in choosing the right tests for screening and diagnosis.
- Epidemiology: In epidemiology, sensitivity and specificity are used to assess the accuracy of diagnostic tests and to estimate disease prevalence.
- Machine Learning: In machine learning, these concepts are used to evaluate the performance of classification models.