Bathymetry
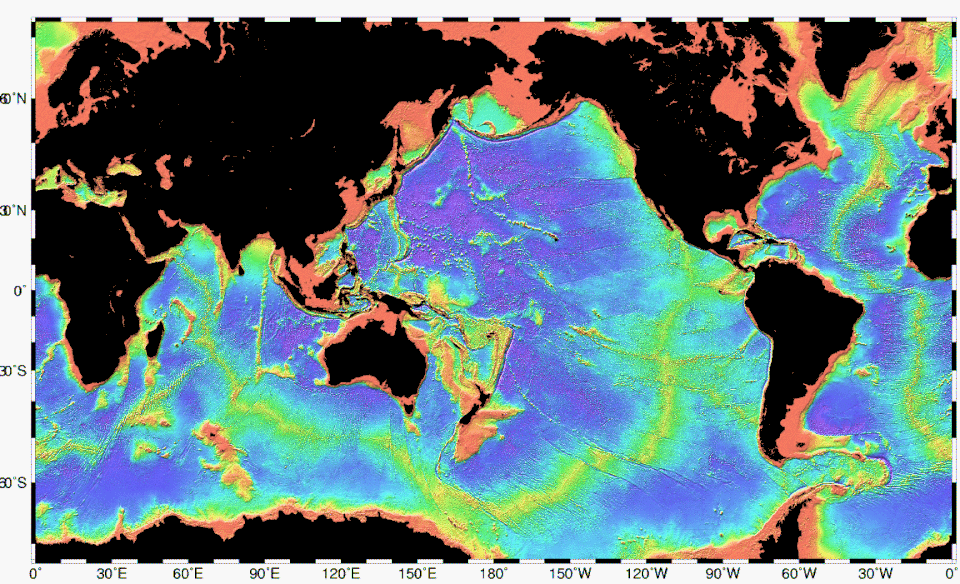
Bathymetry of the ocean floor showing land (black), continental shelves and oceanic plateaus (red), the mid-ocean ridges (yellow-green) and the abyssal plains (blue to purple)
Bathymetry[1][2] (/bəˈθɪmətɹi/) is the study of underwater depth of ocean floors (seabed topography), river floors, or lake floors. In other words, bathymetry is the underwater equivalent to hypsometry or topography. The first recorded evidence of water depth measurements are from Ancient Egypt over 3000 years ago.[3] Bathymetry has various uses including the production of bathymetric charts to guide vessels and identify underwater hazards, the study of marine life near the floor of water bodies, coastline analysis and ocean dynamics, including predicting currents and tides.[4]
Bathymetric charts (not to be confused with hydrographic charts), are typically produced to support safety of surface or sub-surface navigation, and usually show seafloor relief or terrain as contour lines (called depth contours or isobaths) and selected depths (soundings), and typically also provide surface navigational information. Bathymetric maps (a more general term where navigational safety is not a concern) may also use a digital terrain model and artificial illumination techniques to illustrate the depths being portrayed. The global bathymetry is sometimes combined with topography data to yield a global relief model. Paleobathymetry is the study of past underwater depths.
Synonyms include seafloor mapping, seabed mapping, seafloor imaging and seabed imaging. Bathymetric measurements are conducted with various methods, from depth sounding, sonar and lidar techniques, to buoys and satellite altimetry. Various methods have advantages and disadvantages and the specific method used depends upon the scale of the area under study, financial means, desired measurement accuracy, and additional variables. Despite modern computer-based research, the ocean seabed in many locations is less measured than the topography of Mars.[5]
see PDF above for complete article, downloaded:
Friday, April 24, 2026 07:34PM
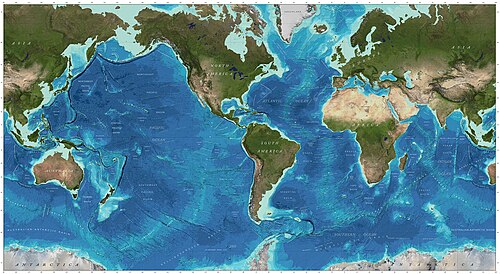
World map with ocean topography
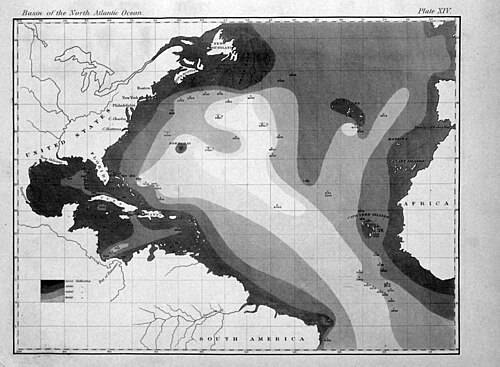
First printed map of oceanic bathymetry, published by Matthew Fontaine Maury with data from USS *Dolphin* (1853)
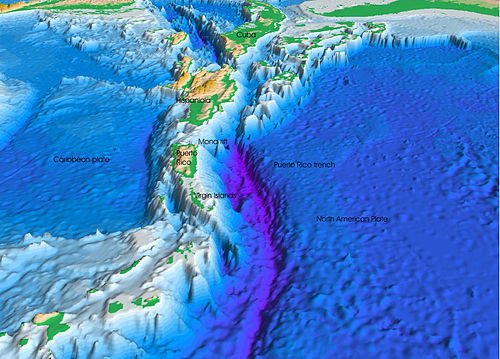
The seafloor topography near the Puerto Rico Trench
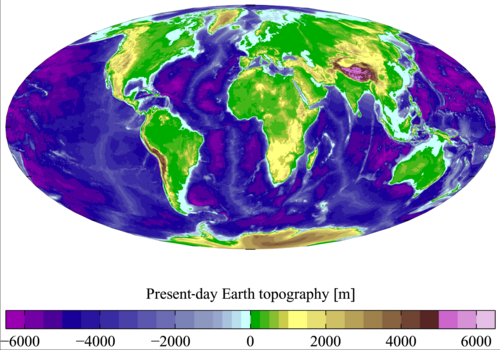
Present-day Earth bathymetry (and altimetry). Data from the National Centers for Environmental Information's TerrainBase Digital Terrain Model.
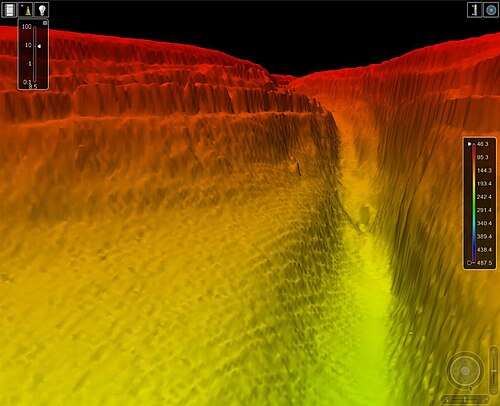
A three-dimensional echo sounding map
A bathymetric chart is a type of isarithmic map that depicts the submerged bathymetry and physiographic features of ocean and sea bottoms.[27] Their primary purpose is to provide detailed depth contours of ocean topography as well as provide the size, shape and distribution of underwater features.
Topographic maps display elevation above ground (topography) and are complementary to bathymetric charts. Bathymetric charts showcase depth using a series of lines and points at equal intervals, called depth contours or isobaths (a type of contour line). A closed shape with increasingly smaller shapes inside of it can indicate an ocean trench or a seamount, or underwater mountain, depending on whether the depths increase or decrease going inward.[28]
Bathymetric surveys and charts are associated with the science of oceanography, particularly marine geology, and underwater engineering or other specialized purposes.
Bathymetric data used to produce charts can also be converted to bathymetric profiles which are vertical sections through a feature.
See also

- Acoustic seabed classification – Partitioning of a seabed acoustic image into discrete physical entities or classes
- Bathometer – Tool for measuring water depth
- Bathymetric chart – Map depicting the submerged terrain of bodies of water
- Coastal morphodynamics – Interaction of shoreline seafloor topography and fluid hydrodynamic processes
- Depth gauge – Instrument that indicates depth below a reference surface
- General Bathymetric Chart of the Oceans – Publicly available bathymetric chart of the world's oceans
- Global relief model – Model of Earth's relief including elevation and depth underwater
- Hydrographic survey – Science of measurement and description of features which affect maritime activities
- Ocean surface topography – Shape of the ocean surface relative to the geoid
- Seabed – Bottom of the ocean
- Terrain – Dimension and shape of land surfaces
- Thalweg – Line of lowest elevation in a watercourse or valley
See PDF above for complete article, downloaded:
Friday, April 24, 2026 07:40PM