in vitro phase separation - NP
in vitro LLPS inhibitor screen
(Guseva Blackledge 2020 SciAdv PMID: 32270045) a library of FDA approved small molecules and identified drugs that affect the number, size, or shape of the N protein droplets. Of these, the kinase inhibitor nilotinib affects N protein condensation with viral RNA in vitro and disrupts condensates formed by the N protein in mammalian cells.
Phase separation may also provide a macroscopic readout to study the N protein and RNA interactions (42) and suggest novel strategies to disrupt packaging of the viral genome. We attempted to identify small molecules that affect N protein phase separation in vitro. We triggered the formation of liquid condensates by mixing 7.8 μM Cy5-labeled N protein and 50 ng/μL polyC RNA in 150 mM NaCl.
We also utilized a high throughput fluorescence microscopy combined with computational image analysis for direct observation of in vitro phase separation of the N protein and determination of mean the droplet size. By screening a 1200-molecule FDA approved library, we identified two molecules that reduced the number of droplets (Class I), three molecules that increased the number and size of the droplets (Class II), and two molecules that changed droplet morphology (Class III).
Class I molecules, nelfinavir mesylate and LDK378, produced fewer but larger droplets
Nelfinavir mesylate reduced droplet number
Class III molecules, nilotinib (a kinase inhibitor) and L-thyroxine (a thyroid hormone receptor agonist), did not quantitatively change droplet count or area (EC50 > 40 μM) but had morphological effects on the droplets at 40 μM
in vitro LLPS assay with NP
(Iserman 2020 BioRxiv PMID: 32587965)
experimental conditions
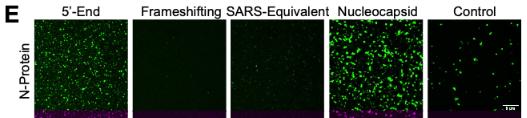
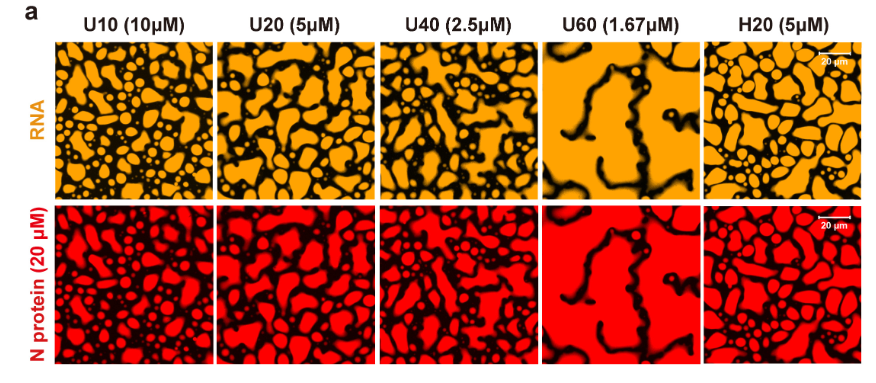
RNA length 5' end works well; best length >1 kb best 3kb
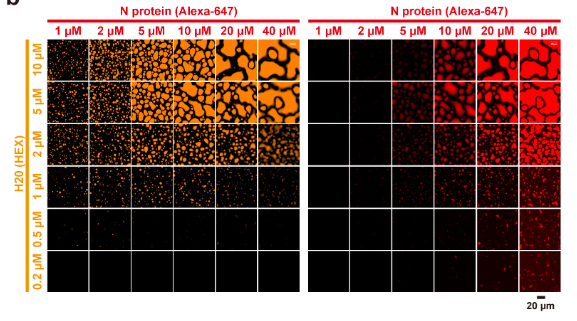
concentrations: 2 uM fluorescent protein; 5nM RNA (see phase diagram)
N-protein phase separates with viral RNA in a length, sequence and concentration dependent manner
unmodified (bacterial) protein yields more and larger droplets
N-protein demixed into droplets on its own and phase separation was enhanced by RNA
which RNA to use
The 5'-End and the subgenomic Nucleocapsid-encoding RNAs promoted LLPS. In contrast, the Frameshifting-region and the SARS-CoV packaging signal-homologous region RNAs reduced phase separation relative to N-protein alone
temperature dependance
N-protein alone demixed into droplets in a temperature dependent manner, most pronounced at fever temperature (40°C) (Figure 2A/B/C/D). Addition of the 5'-End RNA resulted in larger N-protein-containing droplets at 37 and 33°C (corresponding to lung and upper airway temperatures, respectively) (15). Similar results were obtained for Nprotein/Nucleocapsid RNA condensates (Figure S2A). This temperature behavior is notable both for its overlap with clinical features and because there are few biological polymers whose phase separation is enhanced at high temperature.
RBD domain is unstable at higher temperature!! - finding stabilizing agents could help
protein labeling
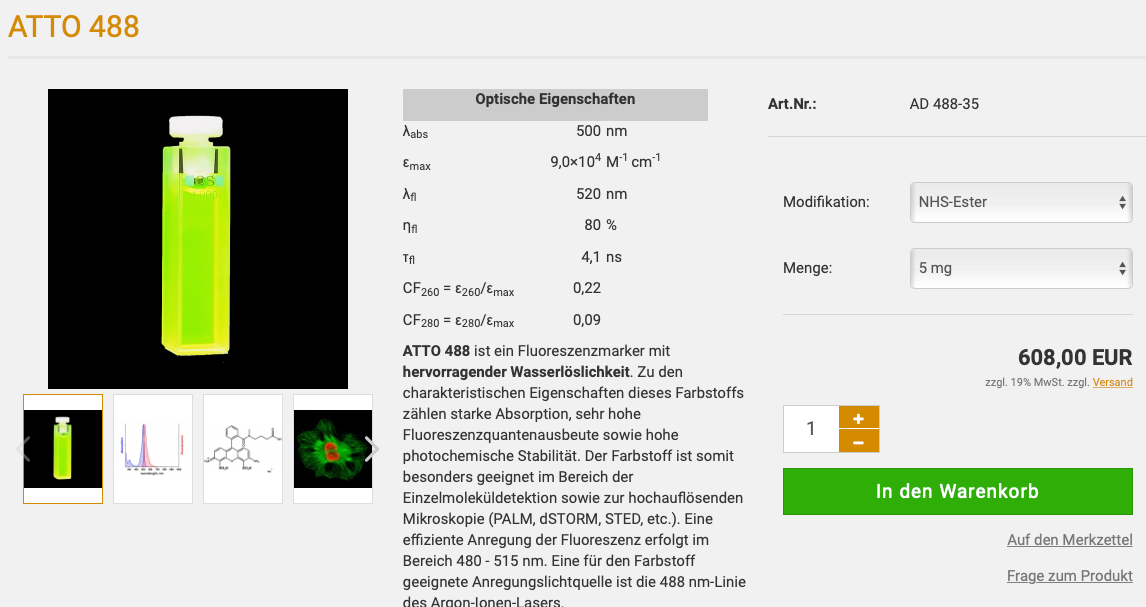
N-protein was dyed by adding (3:1) Atto 488 NHS ester (Millipore Sigma 41698) to purified protein and incubating mix at 30°C for 30 minutes. Unbound dye was removed by 2 washes with 100X excess of protein storage buffer followed by centrifugation in Amicon® Ultra-4 Centrifugal Filter Units (SIGMA MilliPORE). LLPS of dyed and undyed protein was compared as quality control and results were similar (data not shown).
phase separation assays
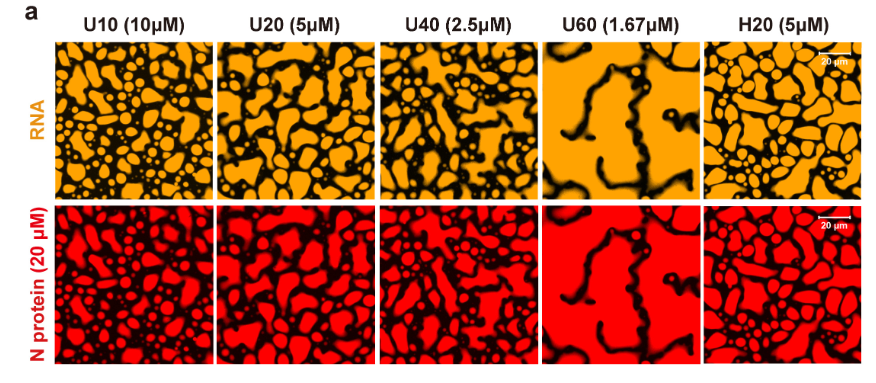
15 µl droplet buffer (20 mM Tris pH 7.5, 150 nM NaCl) was mixed with cy3 or cy5 labeled desired RNA and 5 µl protein in storage buffer was added at desired concentration. The mix was incubated in 384-well plates (Cellvis P384-1.5H-N) for 16 hours at 37°C unless indicated otherwise. Droplets already formed after short incubations of 20 minutes or less, however, they were initially smaller and matured into larger droplets during the overnight incubation step. Imaging of droplets was done on a spinning disc confocal microscope
Turbidity assay
(Zavastano Zweckstetter 2020 PMID: 33247108 ) Phase diagrams of non-phosphorylated and phosphorylated NSARS-CoV-2 at different concentrations were determined using a NanoDrop spectrophotometer (ThermoFisher Scientific, Invitrogen). Increasing concentrations of polyU (0 - 2 µM) were added immediately before the experiments, followed by thoroughly pipetting and measurement of turbidity at 350 nm UV-Vis. Averages turbidity values were derived from measurements of three independent, freshly prepared samples.
alternative turbidity assay
(Perdikari Fawzi PMID: 32577653)Turbidity experiments were performed in a 96-well clear plate (Costar) with 70 μL samples sealed with optical adhesive film to prevent evaporation (MicroAmp, ThermoFisher). The absorbance at 600 nm was monitored over time using a Cytation 5 Cell Imaging Multi-Mode Reader (BioTek) at 5 min time intervals for up to 12 hr with mixing.
Microscopy
For fluorescence microscopy, proteins were labeled using Alexa-fluor 488TM (green) or Alexa-fluor 594TM (red) microscale protein labeling kits (ThermoFisher Scientific, Invitrogen). Small amounts (0.3 µl) of fluorescently-labeled NSARS-COV-2 were premixed with unlabeled NSARS-COV-2 and diluted to 50 µM final concentration with NaPi 20 mM buffer, pH 7.5. PolyU was added to the mixture to reach a final concentration of 1 µM. 5 µl of the sample were subsequently loaded onto a slide and covered with a 18 mm coverslip. DIC and fluorescent micrographs were acquired on a Leica DM6B microscope with a 63× objective (water immersion) and processed using Fiji software (NIH). For RNA recruitment assays, fluorescently labeled RNA was premixed with 1 µM polyU and subsequently added to the mixture of fluorescently labeled/unlabeled NSARS-COV-2. For nsp12/RdRp/RNA recruitment assays, the fluorescently labeled component (FAM-labeled RNA scaffold, nsp12 or RdRp/RNAcomplex) was premixed with 1 µM polyU, followed by addition to a mixture of fluorescently labeled/unlabeled NSARS-COV-2.
(Chen Lou CellRes 2020 PMID: 32901111)
Imaging and data analysis of phase separation: Phase separation assays were performed in 1× PBS (pH 7.4) supplemented with 2.5% PEG8000 unless otherwise noted. A microwell 96-well optical-bottom plates with polymer base was coated with 1% BSA at 4 °C overnight and then washed with PBS three times. Phase separation was induced with RNA addition and then transferred in 96-well plate at room temperature for 1 h.
Imaging was performed with Olympus FV1200 equipped with a 60× oil immersion objective, and 3-6 regions were randomly selected for image acquisition. All images were processed with FV10-ASW, the percentage area of the image occupied by droplets was calculated based on the method from the published research 3.
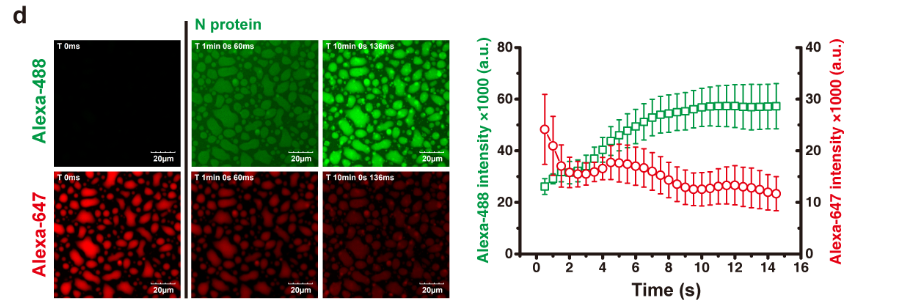
dynamics of droplets
length dependence of RNA
How should we label the protein
Atto-Tec
dye spectrum - Atto488 green / cy3 yellow / cy5 red
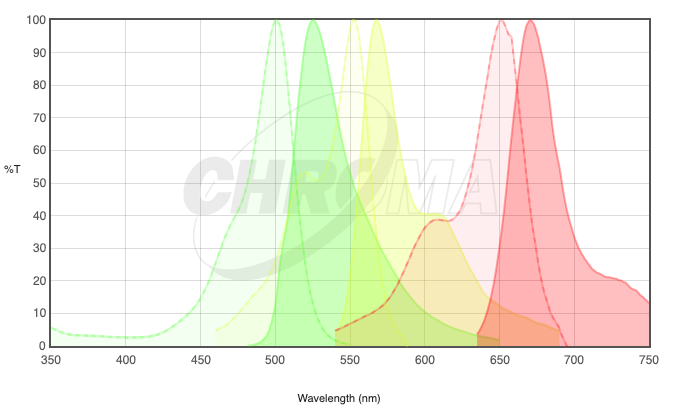
our dy-647 NHS-Ester corresponds to Cy5