Simulation einer Epidemie
3.05M subscribers
SUBSCRIBED
Experiments with toy SIR models Home page: https://www.3blue1brown.comBrought to you by you: http://3b1b.co/sir-thanks Awesome fan-made interactives:https://prajwalsouza.github.io/Experi...https://learningsim.itch.io/pandemic-...Simulations by Harry Stevens at the Washington Post:https://www.washingtonpost.com/graphi...Simulations by Kevin Simler at Melting Asphalt:https://meltingasphalt.com/interactiv...Excellent visualization of each country's current growth from Minutephysics and Aatish Bhatia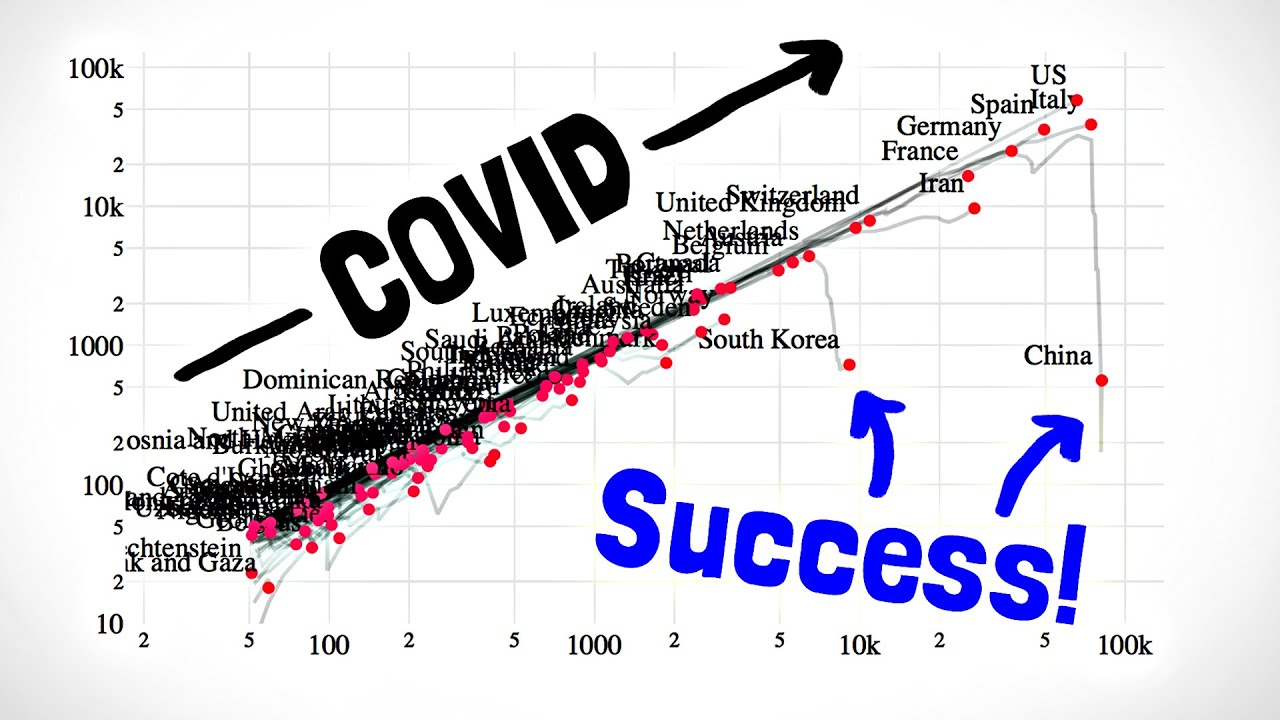 Another good interactive to see what effect various parameters have on the shape of the curve:http://gabgoh.github.io/COVID/index.htmlIf you want to hear a mathematician/epidemiologist's summary of COVID-19, I found this MSRI talk very worthwhile
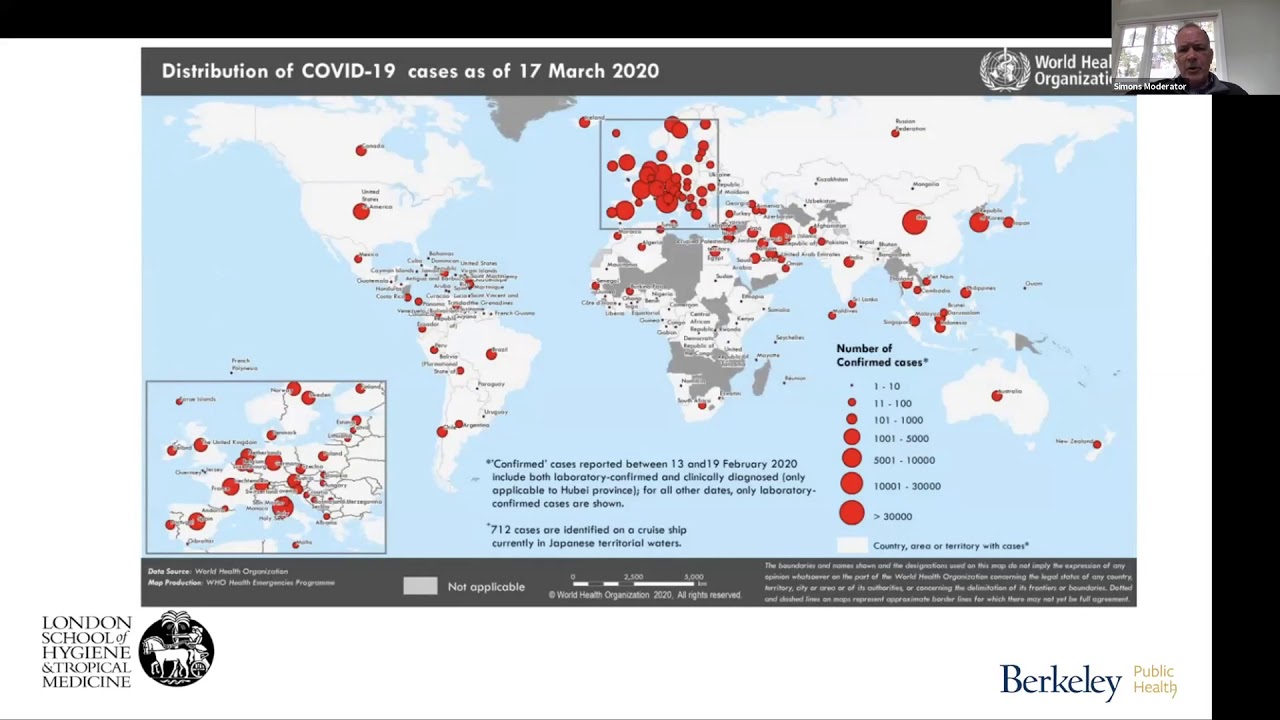 Marcel Salathé on Contact Tracing:https://twitter.com/marcelsalathe/sta...------------------ These animations are largely made using manim, a scrappy open-source python library: https://github.com/3b1b/manimIf you want to check it out, I feel compelled to warn you that it's not the most well-documented tool, and it has many other quirks you might expect in a library someone wrote with only their own use in mind. The source code for this video is visible at the link below, but the, er, awkward part is that it was made on a branch of manim where I'm reworking a lot of other things and have yet to work out all the kinks or add any documentation, so I'm not entirely sure how easy it will be for others to get running. In either case, you should be able to easily see how all the simulations worked.https://github.com/3b1b/manim/blob/sh... Honestly, given that the code for that video is meant for demo purposes, and not meant to reflect the true data of COVID-19, if you want to apply these ideas to the current situation I'd recommend looking for more professional epidemiological modeling tools that are less centered around animations and pedagogy and more focused on accurate predictions. For example, the Institute for Disease Modeling has a lot of models free for people to look at and play with. --------------- Opening music: Candlepower by Chris Zabriskie is licensed under a Creative Commons Attribution license (https://creativecommons.org/licenses/...) Source: http://chriszabriskie.com/divider/Artist: http://chriszabriskie.com/Other music by Vincent Rubinetti. Download the music on Bandcamp:
https://vincerubinetti.bandcamp.com/a... Stream the music on Spotify:
https://open.spotify.com/album/1dVyjw... If you want to contribute translated subtitles or to help review those that have already been made by others and need approval, you can click the gear icon in the video and go to subtitles/cc, then "add subtitles/cc". I really appreciate those who do this, as it helps make the lessons accessible to more people. ------------------ 3blue1brown is a channel about animating math, in all senses of the word animate. And you know the drill with YouTube, if you want to stay posted on new videos, subscribe: http://3b1b.co/subscribe Various social media stuffs: Website: https://www.3blue1brown.comTwitter: https://twitter.com/3blue1brownReddit: https://www.reddit.com/r/3blue1brownInstagram: https://www.instagram.com/3blue1brown...Patreon: https://patreon.com/3blue1brownFacebook: https://www.facebook.com/3blue1brown
Caption author (Russian)
Caption authors (Spanish (Latin America))
Hector Alejanro Bravo GallardoJorge Johan Carmona Muñoz
Caption author (Polish)
Caption author (Arabic)
Caption author (Japanese)
Caption authors (Spanish)
Rafael RibasFredi MinoDaniel Armesto
Caption authors (Italian)
Leonardo FrancoMatteo BesharaTiziano CoroneoGabriele Candela
Caption authors (French)
Caption authors (Portuguese)
LmalukoEddie MartinsVitor Dantas12jgyBruno Bassi
00:02
I want to share with you a few toy simulations that model how an epidemic spreads.
00:06
There have recently been a few wonderful interactive articles in this vein, including one in the
00:11
Washington Post by Harry Stevens, and one by Kevin Similer over at Melting Asphalt;
00:17
they’re great, you can play with them, it’s very informative, and of course I’ll leave
00:20
links in the description.
00:22
After seeing those I had a few more questions.
00:24
Like, if people stay away from each other I get how that will slow the spread, but what
00:29
if despite mostly staying away from each other people still occasionally go to a central
00:33
location like a grocery store or a school?
00:37
Also, what if you are able to identify and isolate the cases?
00:41
And if you can, what if a few slip through, say because they show no symptoms and aren’t
00:46
tested?
00:47
How does travel between separate communities affect things?
00:50
And what if people avoid contact with others for a while, but then they kind of get tired
00:55
of it and stop?
01:01
We’ll explore these questions and more, but first let’s walk through how exactly
01:10
our models will work.
01:12
These simulations represent what’s called an “SIR model”, meaning the population
01:17
is broken up into three categories, those who are susceptible to the given disease,
01:22
those who are infectious, and those who have recovered from the infection.
01:26
The way I’ve written them, for every unit of time a susceptible person spends within
01:34
a certain “infection radius” of someone with the disease, they’ll have some probability
01:39
of contracting it themselves.
01:40
So we’re using physical proximity as a stand-in for things like shaking hands, touching the
01:45
same surfaces, kissing, sneezing on each other, all that good stuff.
01:49
Then for each infectious person, after a given period of time, they’ll recover and no longer
01:54
be able to spread the disease.
01:56
If they die, they also won’t be able to spread it anymore, so as a more generic term
02:01
sometimes people consider the “R” in “SIR” to stand for “removed”.
02:07
This should go without saying, but I’ll emphasize it anyway: These are toy models,
02:12
with a tiny population, inevitably falling far short of the complexities in real people
02:16
and larger populations.
02:18
I’m no epidemiologist, so I’d be very hesitant to generalize any of the lessons
02:23
here without deeper consideration.
02:26
That said, I think it can be healthy to engage the little scientist inside all of us and
02:30
take the chance to be experimental and quantitative even if it’s in a necessarily limited fashion,
02:37
especially if the alternative is to dwell on headlines and uncertainty.
02:40
Establishing simulations We’ll start simple and layer on more complexity
02:44
gradually.
02:45
In these first runs that you’re seeing, everyone just meanders about the city, and
02:49
the infection follows the rules we’ve laid out.
02:57
So... it’s not looking great.
03:02
It doesn’t take too long before almost everyone gets infected.
03:09
As a sanity check, what would you expect to happen if I double this radius of infection?
03:14
You might think of this as representing more total interactions between people; a more
03:18
socially engaged society.
03:20
It’ll spread more quickly, of course, but how much?
03:25
It’s actually very dramatic!
03:31
Within a short span the majority of our little population is infected simultaneously.
03:37
As another sanity check, what do you expect if we go back to the original infection radius,
03:41
and then cut the probability of infection in half?
03:45
Remember, for each unit of time a susceptible person is within the infection radius of an
03:50
infectious person, they have some probability of becoming infected, which by default I have
03:55
set to 20%.
03:56
This is the number we’re cutting in half now.
03:58
You could think of this better hand washing, cough protection, and less face touching.
04:16
As you might expect, it spreads out the curve.
04:19
In fact, it does so by quite a lot, really illustrating how changes to hygiene can have
04:24
very large effects on the rate of spreading.
04:30
The first key takeaway to tuck away in your mind is just how sensitive this growth is
04:35
to each parameter in our control.
04:38
It’s not hard to imagine changing your daily habits in ways that multiply the number of
04:42
people you interact with or that cut your probability of catching an infection in half;
04:47
but the implications for the pace of this spread are huge.
04:51
The goal is probably to reduce the total number of people who die, which is some proportion
04:56
of this “removed” category in the end.
04:59
That proportion is not a constant, though.
05:01
If you get to a point where the peak of this infection curve is too high, meaning there’s
05:05
a time when many people are sick at once, that’s when available healthcare resources
05:10
are overwhelmed, increasing that mortality rate.
05:15
Now, I don’t know where you’re from, but in most towns, people don’t actually spend
05:19
their days drunkenly wandering through the city like this.
05:22
Often there’s a common destination, like a central market or a school, that people
05:26
need to go to.
05:27
In our model, if we introduce a central spot like this that people regularly visit then
05:30
return from, it’s...well...just look.
05:35
One of the main things I was curious about is how to mitigate this effect.
05:42
We’ll examine that in just a bit.
05:45
Another feature we could include is to have a few separate communities, with travel between
05:50
them.
05:51
Every day, each person will have some probability of traveling to another community, where they
05:56
arrive at a central location.
06:00
That’s our basic setup, now what actions help to stop this spread?
06:07
What’s most effective is to identify and isolate whoever is infectious, for example
06:14
with good testing and quick responsiveness.
06:16
For our simulations, once we hit some critical threshold of cases, we’ll start sending
06:21
people to a separate location 1 day after they get the infection.
06:25
This is, of course, just a stand-in for whatever isolation would look like in the real world;
06:30
it doesn’t have to literally be transporting all the sick people in one sad box.
06:34
Unsurprisingly, this totally halts an epidemic in its tracks.
06:39
But what if when you’re infected, you have a 20% chance of not getting quarantined, say
06:43
because you show no symptoms and don’t get tested, so you go about your day as usual?
06:48
We’ll illustrate these people who have no symptoms with yellow circles instead of red.
06:53
Obviously this will have a result somewhere between the total quarantine and doing nothing,
06:58
but where on that spectrum would you predict it will be?
07:18
The peak number of cases at the same time is only a tiny bit higher, but there’s a
07:23
long tail as it takes much longer to stamp out, resulting in about twice as many total
07:28
cases.
07:31
This gets more interesting when we do it in the setting with many communities and travel
07:34
between them.
07:35
Again, totally effective tracking and isolation stops the epidemic very effectively, but what
07:40
do you predict will happen if 20% of infectious cases slip through this process?
07:46
Again, I’ve set things to wait until a certain critical threshold of cases is hit before
07:50
our little dot society kicks into gear and takes action.
07:56
Even when all the parameters are the same, it’s interesting that in some runs it can
07:58
take around three times longer to reach this point than others; before the law of large
08:02
numbers kicks in, the pace of growth can have as much to do with a role of the dice as it
08:06
does with anything intrinsic to the disease itself.
08:21
It does keep the curve flat, but now it’s a much thicker tail during the long time it
08:24
takes to track all the cases, with over half the population getting affected this time.
08:35
What would you predict if only 50% of infectious cases are isolated like this?
08:41
If half the infectious population is getting quarantined, it doesn’t mean half the total
08:45
population will end up with the disease.
08:48
Because there are still so many agents out there spreading it, we end up with a situation
08:52
that’s only barely better than if nothing had been done at all.
09:00
A second key takeaway here is that changes in how many people slip through the tests
09:05
cause disproportionately large changes to the total number of people infected.
09:12
The fact that quickly containing cases early is so effective has an interesting corollary,
09:17
which is that the most lethal diseases are, in some sense, less dangerous globally.
09:23
Remember that the rule in these quarantine simulations is to send infectious people to
09:26
a separate location one day after they’ve been infected.
09:30
But if the disease kills its host in one day, the model looks identical, it just has a much
09:35
darker interpretation.
09:37
It’s terrible for those who get it, but it doesn’t spread.
09:42
It also means that the most dangerous viruses are the ones that kill some part of the population,
09:47
while laying unnoticed and spreadable among others.
09:50
Or worse yet, if they remain unnoticed and spreadable in everyone before becoming lethal.
09:57
One of the reasons the SARS outbreak in 2002 was so well contained is that just about everyone
10:02
in this infectious population was showing symptoms, and so were easier to identify and
10:07
isolate.
10:08
A more optimistic corollary is how useful early treatment can be.
10:15
If there exists an antiviral therapeutic that can move people out of this infectious category
10:19
quickly, it has the same effect on the model as isolating those cases.
10:24
But let’s say you don’t have widespread testing, or antiviral therapeutics.
10:33
We’ll introduce a new parameter here, which is how much people try to avoid each other.
10:38
Let’s call it the “social distance factor”.
10:41
In these animations, I’ll apply it as a repulsive force between people, and have them
10:45
glow yellow when they feel a little too close to their neighbor.
10:49
This has the sad-but-cute effect that when our little agents are social distancing, they
10:54
often end up trembling near the edge.
10:57
No isolation is perfect, though, so every now and then even those
11:01
repulsed by others will jiggle close enough to get infected; the point is that it’s
11:07
much rarer.
11:08
Let’s take a look at four separate runs here.
11:10
In each of them, after they hit 50 cases, we’ll turn on social distancing.
11:15
For the top left, we turn it on for everyone, in the top right, we turn it on for 90% of
11:21
the population.
11:22
In the bottom left, 70%, and in the bottom right, 50%.
11:29
What do you think will happen?
11:38
As you might expect, when 100% of people avoid each other, the disease quickly goes away
11:43
entirely.
11:45
In all four cases, the presence of widespread social distancing absolutely flattens the
11:50
curve.
11:51
However, in terms of the long-term number of cases, the run with 70%, and even the one
11:56
with 90%, end up with a little less than half the population ultimately getting infected,
12:01
and the run with 50% is only a little bit worse than that.
12:03
The case with 90% of people repelled by all others takes longer to get there, but evidently
12:10
a mere 10% of the population cheating adds enough instability to keep the fire slowly
12:16
burning for a long time.
12:19
Again, I’ll emphasize these are toy models, and I leave it to the intelligence of the
12:26
viewer to judge if the behavior of these dots accurately reflects what social distancing
12:31
would mean for you and your life.
12:34
Someone fully sequestered to their home is not necessarily affected by the random jigglings
12:38
of their neighbor.
12:40
But then again, few people live genuinely independently from everyone else.
12:45
Insofar as these models aren’t outlandish, the third key takeaway is that social distancing
12:50
absolutely works to flatten the curve, but even small imperfections prolong the spread
12:54
for a while.
12:56
Now let’s look at our setup with 12 communities and travel between them.
13:02
By default, I have it set where every day each agent has a 2% chance of traveling to
13:07
the center of a different community.
13:10
Let’s try a run where once we hit 100 cases, we cut down this travel rate by a factor of
13:17
4, to only half a percent.
13:19
What do you think will happen?
13:36
The honest answer is that it depends.
13:39
In some runs, it doesn’t make any difference and the majority of every community gets it.
13:44
Other times, a few communities end up unscathed.
13:49
In general, the earlier you turn this on the more effective it is, but the takeaway here
13:57
is that reducing contact between communities has only a limited effect once many communities
14:02
already have it.
14:09
As a side note, when we run these simulations with larger cities, which has the effect that
14:13
the city centers act like concentrated urban hubs, you can see how once the infection hits
14:19
one urban center, it very quickly hits all of them, and slowly spreads to the edges from
14:30
there.
14:32
Let’s take a moment to talk about how to quantify the rate of this spread.
14:38
Consider one person with the disease, and count how many other people they infect while
14:42
they have it.
14:46
The average for this count across everyone who has been sick is known as the effective
14:50
reproductive number, or R.
14:53
A more commonly discussed number is R_0, which is the value of R in a fully susceptible population,
14:59
like at the very beginning.
15:01
This is called the “Basic” reproductive number.
15:06
You may notice I’ve had this label on the simulations, where the way it’s calculated
15:11
is to look at each individual who is currently infectious, count how many they’ve infected
15:16
so far, estimate how many they’ll infect in total based on the duration of the illness,
15:21
then average those numbers.
15:25
For example, in our first default simulation with no added spices, R is around 2.2 in the
15:31
highest growth phase, before falling down as the population becomes saturated.
15:36
By contrast, when we doubled the infection radius, R was as high as 8!
15:41
That factor has a huge effect on the growth rate, hence the explosive spreading.
15:46
This kind of makes sense; when you double that radius, there’s about 4 times as many
15:51
people inside it to infect.
15:54
When we chopped the infection rate in half, it hovered around the 1.3 to 1.7 range.
16:02
While R is greater than 1, the infection is growing exponentially, and is known as an
16:07
epidemic.
16:08
If it holds steady around 1, it’s called “endemic”.
16:13
And less than 1 means it’s on the decline.
16:16
For comparison, R0 for COVID-19 is estimated to be a little above 2, which is also around
16:22
the mean estimate for R0 during the 1918 Spanish flu pandemic.
16:27
The seasonal flu, by comparison, is much lower, around 1.3.
16:30
For our toy epidemic in the travel case, when we turn on social distancing and shut down
16:36
travel, you can see R quickly drop down from 2.
16:53
Like I said at the start, one of the things I was most curious about is the effects of
16:56
some kind of shared central location, like a market or a school.
17:01
When I introduce such a destination for our little dots, R jumps up as high as 5.8.
17:08
This might be a little unfair, since it puts everyone right in the same spot, and given
17:13
that we’re using physical proximity as a stand in for things like shaking hands or
17:17
kissing, we should acknowledge that people going to the same school or grocery store
17:21
are not as likely to spread an infection as, say, people living in the same house.
17:27
To account for this let’s cut the probability of infection per day in half.
17:33
This does indeed cut the peak value of R in half, but the effect of a central market remains
17:38
dramatic.
17:42
Let’s try a run where after some threshold is hit, we turn on social distancing, but
17:51
people still go to the central location as usual.
17:59
You may have noticed that some of the dots have escaped their little cage...which was
18:04
not supposed to happen, but I’m gonna make the conscious choice not to fix that.
18:09
It’s like they all looked at the chaos inside and went “Nope, I’m out!
18:13
I don’t want any part of that!”.
18:15
Living in the Bay area during a shelter-in-place order, I can confirm this is how some people
18:19
react.
18:21
Wandering dots aside, though, let me show you how this graph compares to the control,
18:26
and how it compares to what would have happened if in addition to repelling away from each
18:30
other, all the dots also stopped going to the central location.
18:35
The peak of the infection curve is a bit lower than the control, but in terms of total number
18:40
of cases, keeping that central location active really defeats the effects of social distancing.
18:48
Now what do you think will be more effective, if on top of the social distancing we decrease
18:55
the frequency with which people go to the central spot by a factor of 5?
19:00
Or if we chop the probability of infection down by another factor of 2, for example meaning
19:06
people practice better hygiene?
19:08
Well, let’s play them both out.
19:12
The left here requires our dots to heavily alter their daily routines, whereas the right
19:18
involves people continuing their usual habits while being much more conscious of hygiene.
19:23
They’re actually nearly identical, which surprised me, given that one of them is a
19:28
fivefold increase and the other is twofold.
19:31
I guess it goes to show that more effective hygiene, which is maybe easier said than done,
19:36
goes a long way.
19:39
Of course, it doesn’t have to be an either or; our goal with these experiments is to
19:44
look at the effects of one change at a time.
19:46
If you’re curious, here’s what it looks like where we apply social distancing, restrict
19:51
the rate that people go to the central location, and also lower the infection rate, all at
19:56
once.
19:58
The combination of them all is, indeed, very effective.
20:03
But I want to emphasize again how the most desirable case is one where you can consistently
20:07
identify and isolate cases.
20:10
Even in this central market simulation, which left unchecked gives a huge conflagration,
20:15
being able to do this effectively really halts the epidemic.
20:19
And our little dots don’t even have to be repelled by each other or stop their trips
20:23
to the market.
20:25
In real epidemiology it gets more sophisticated than this, with tactics like “contact tracing”
20:31
where you not only identify and isolate known cases, but you do the same for everyone who’s
20:36
been in contact with those cases.
20:42
Given the time I’m posting this, I imagine there’s some expectation for it to be a
20:46
PSA on social distancing.
20:48
But to be honest, that’s not really my own main takeaway.
20:51
To be clear, when it’s needed, like it is now, social distancing absolutely saves lives,
20:57
and as we saw earlier when people cheat, or continue regularly meeting in a central spot,
21:02
it has disproportionate effects on the long-term number of cases.
21:06
The uncomfortable truth, though, is that while the disease still exists, as soon as people
21:10
let up and go back to their normal lives, if there’s nothing in place to contain the
21:14
cases you’ll just get a second wave.
21:22
After making all these, what I came away with more than anything was a deeper appreciation
21:26
for disease control done right; for the inordinate value of early widespread testing and the
21:32
ability to isolate cases; for the therapeutics that treat these cases, and most importantly
21:37
for how easy it is to underestimate all that value when times are good.
21:41
I’m writing this during a pandemic, when some viewers may be able to identify all too
21:46
well with the trembling dots retreating to the edge of their box.
21:50
But in the future many people will be watching it during a pandemic that never was; a time
21:55
when a novel pathogen that would spread widely if left unchecked is instead swiftly found
22:00
and contained.
22:02
Those would-be pandemics never make it into the history books, which is maybe why we don’t
22:06
value the heros behind them the way we should.
22:09
Living in a world with widespread travel and vibrant urban centers does make fighting the
22:13
spread of a disease an uphill battle, it’s true.
22:17
But that same level of connectedness means ideas spread more quickly than ever, ideas
22:21
that can lead to the systems and technologies which nip outbreaks in the bud.
22:25
It won’t happen on it’s own, and it’s clear that we sometimes make mistakes, but
22:30
I’m fundamentally optimistic about our ability to learn from those mistakes.
22:38
As you might imagine, these videos require a lot of hours and effort.
22:41
I don’t do ad reads at the end, and YouTube content related to the current pandemic seems
22:46
to be systematically demonetized, so I just wanted to take this chance to say a particularly
22:50
warm thanks to those who support them directly on Patreon.
22:53
It really does make a difference.