COVID-19
3.05M subscribers
SUBSCRIBED
A good time for a primer on exponential and logistic growth, no? Home page: https://www.3blue1brown.comBrought to you by you: http://3b1b.co/covid-thanksExcellent visualization of this kind of growth from Minutephysics and Aatish Bhatia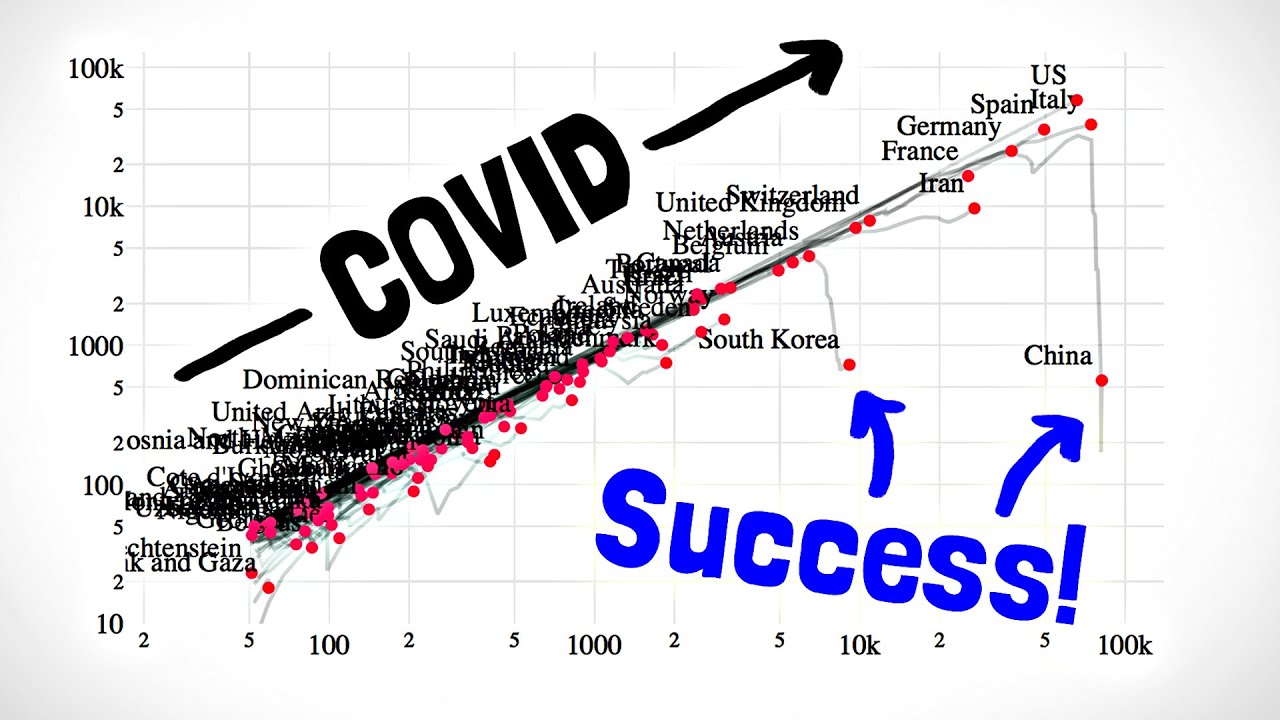 Data source: https://www.worldometers.info/coronav...Some have (quite rightfully) commented on how you shouldn't look at the R2 of linear regressions on cumulative data since even if the changes from one day to the next are completely random, the totals they add up to wouldn't be independent of each other. Since the derivative of an exponential should also be an exponential, we could instead run the same test on the logarithms of the differences from day to day, which in this case gives R2 = 0.91. While this video uses COVID-19 as a motivating example, the main goal is simply a math lesson on exponentials and logistic curves. If you're looking for a video more focused on COVID-19 itself, I'd recommend taking a look at this one from Osmosis:
 Extrapolation xkcd: https://xkcd.com/605/------------------ These animations are largely made using manim, a scrappy open source python library: https://github.com/3b1b/manim If you want to check it out, I feel compelled to warn you that it's not the most well-documented tool, and it has many other quirks you might expect in a library someone wrote with only their own use in mind. Music by Vincent Rubinetti. Download the music on Bandcamp:
https://vincerubinetti.bandcamp.com/a... Stream the music on Spotify:
https://open.spotify.com/album/1dVyjw... If you want to contribute translated subtitles or to help review those that have already been made by others and need approval, you can click the gear icon in the video and go to subtitles/cc, then "add subtitles/cc". I really appreciate those who do this, as it helps make the lessons accessible to more people. ------------------ 3blue1brown is a channel about animating math, in all senses of the word animate. And you know the drill with YouTube, if you want to stay posted on new videos, subscribe: http://3b1b.co/subscribe Various social media stuffs: Website: https://www.3blue1brown.comTwitter: https://twitter.com/3blue1brownReddit: https://www.reddit.com/r/3blue1brownInstagram: https://www.instagram.com/3blue1brown...Patreon: https://patreon.com/3blue1brownFacebook: https://www.facebook.com/3blue1brown
Caption author (German)
Caption author (Korean)
Caption author (Hebrew)
Caption author (Czech)
Caption authors (Italian)
Elia FranchiniEdoardo396MarcoGiacomo Bagnato
Caption author (Arabic)
Caption authors (Japanese)
Caption authors (Spanish)
Sebastián AcedGianluca Corazzari
Caption author (Vietnamese)
Caption author (Russian)
Caption author (Portuguese (Portugal))
Caption author (Dutch)
Caption author (Chinese (Traditional))
Caption author (Portuguese)
Caption author (Persian)
00:03
The phrase “exponential growth” is familiar to most people, and yet human intuition has
00:08
a hard time really recognizing what it means sometimes.
00:11
We can anchor on a sequence of small seeming numbers, then become surprised with suddenly
00:15
those numbers look big, even if the overall trend follows an exponential perfectly consistently.
00:22
This right here is the data for recorded cases of COVID-19, aka the Coronavirus, outside
00:28
mainland China, at least as of the time I’m writing this.
00:30
Never one to waste an opportunity for a math lesson, I thought this might be a good time
00:34
for us all to go back to the basics on what exponential growth is, where it comes from,
00:39
what it implies, and maybe most pressingly, how to know when it’s coming to an end.
00:44
Exponential growth means as you go from one day to the next, it involves multiplying by
00:49
some constant.
00:50
In our data, the number of cases each day tends to be between 1.15 and 1.25 times the
00:57
number of cases the previous day.
01:00
Viruses are a textbook example of this kind of growth because what causes new cases are
01:05
the existing cases.
01:09
If the number of cases on a given day is N, and we say each individual with the virus
01:14
is, on average, exposed to E people on a given day, and each exposure has a probability p
01:21
of becoming an infection, the number of new cases each day is EpN. The fact that N itself
01:31
is a part of this is what really makes things go fast because as N gets big, the rate it
01:38
grows also gets big.
01:40
One way to think of this is that as you add on these new cases to get the next day’s
01:44
count, you can factor out the N, so it’s just the same as multiplying by some constant
01:51
bigger than 1.
01:52
This is sometimes easier to see if we put the y-axis on a logarithmic scale, meaning
01:58
each step of a fixed distance corresponds to multiplying by a certain factor; in this
02:03
case, each step is another power of 10.
02:05
On this scale, exponential growth looks like a straight line.
02:09
With our data, it took 20 days to go from 100 to 1,000, and 13 days to go from that
02:16
to 10,000, and by doing a linear regression to find the best fit line, you can look at
02:21
the slope of that line to say it tends to multiply by 10 every 16 days on average.
02:28
This regression also lets us be more quantitative about how close the exponential fit really
02:33
is, and to use the technical jargon here, the answer is that it’s really freaking
02:38
close.
02:39
It can be hard to digest what this really means, if true.
02:42
If you see one country with 6,000 cases, while another has 60, it’s easy to think the second
02:48
is doing 100 times better and, hence doing fine.
02:51
But if you’re in a situation where numbers multiply by 10 every 16 days, another way
02:56
to view the same fact is that the second country is about a month behind the first.
03:01
This is, of course, rather worrying if you draw out the line.
03:05
I’m recording this on March 6th, and if the present trend continues, it would mean
03:08
hitting 1M cases in 30 days (April 5th), hitting 10M in 47 days (April 22nd), 100M in 64 days
03:15
(May 9th), and 1 billion in 81 days (May 26th).
03:19
Needless to say, though, you can’t draw out a line like this forever, it clearly must
03:23
start slowing down at some point, but the crucial question is when.
03:28
Is it like the SARS outbreak of 2002 capped out at about 8,000 cases, or more like the
03:33
Spanish Flu in 1918 ultimately infected about 27% of the world’s population?
03:40
In general, just drawing a line through your data is not a great way to make predictions,
03:45
but remember that there’s an actual reason to expect an exponential here.
03:49
If the number of new cases each day is proportional to the number of existing cases, it means
03:55
each day you multiply by some constant, so moving forward d days is the same as multiplying
04:00
by that constant d times.
04:02
It is inevitable, though, that this factor in front of N eventually decreases.
04:10
Even in the most perfectly pernicious model for a virus, which would be where every day,
04:15
each person with the virus is exposed to a random subset of the world’s population,
04:20
at some point most of the people they’re exposed to will already be sick, and so can’t
04:24
become new cases.
04:28
In our equation, this means the probability of infection should include some factor to
04:35
account for the probability that a person you’re exposed to isn’t already infected,
04:38
which for a random exposure model would be (1 - the proportion of people in the world
04:45
who are infected).
04:46
When you include a factor like that and solve for how N grows, you get what’s known as
04:52
a logistic curve, which is essentially indistinguishable from an exponential at the beginning, but
04:57
ultimately levels upon approaching the total population size, as you’d expect.
05:03
True exponentials essentially never exist in the real world, they’re all the beginnings
05:08
of logistic curves.
05:09
The point where this curve goes from curving up to instead curving down is known as the
05:15
“inflection point”.
05:16
At that point, the number of new cases each day, represented by the slope of this curve,
05:24
is roughly constant, and will soon start decreasing.
05:30
So one number that people will often follow with epidemics is the “growth factor”,
05:34
which defined as the ratio between the number of new cases one day, and the number of new
05:39
cases the previous day.
05:41
So, just to be clear, if you were looking at the totals from on day to the next, then
05:46
tracking the changes between these totals, the growth factor is the ratio between two
05:51
successive changes.
05:55
While you’re growing exponentially, this factor will stay consistently above 1, whereas
06:00
seeing a growth factor around 1 is a sign you’ve hit the inflection.
06:05
This can make for another counterintuitive fact while following the data.
06:09
Think about what it would look like for the number of new cases one day to be about 15%
06:13
more than the number of new cases the previous day, and contrast that with what it would
06:18
feel like for it to be about the same.
06:21
Just looking at the totals, they really don’t feel that different, but if the growth factor
06:27
is 1, it could mean you’re at the inflection point of a logistic, which means the total
06:32
number of cases will max out around 2 times wherever you are now.
06:37
But a growth factor bigger than 1 means you’re on the exponential part, which could imply
06:43
orders of magnitude of growth still lie ahead of you.
06:49
While in the worst case this saturation point would be the total population, it’s of course
06:55
not true that people with the virus are randomly shuffled around the world’s population like
06:59
this, people are clustered in communities.
07:02
But when you run simulations where there’s even a little bit of travel between the clusters
07:07
like these, the growth is not actually much different.
07:14
What you end up with is a kind of fractal pattern, where communities themselves function
07:18
like individuals.
07:20
Each one has some exposure to others, with some probability of spreading the infection,
07:25
so the same underlying exponential-inducing laws apply.
07:36
Fortunately, saturating the whole population is not the only thing that causes the growth
07:47
factor to slow.
07:49
The amount of exposure goes down when people stop gather and traveling, and the infection
07:54
rate goes down when people wash their hands more.
07:57
The other thing that’s counterintuitive about exponential growth is how sensitive
08:02
it is to this constant.
08:05
For example, if it’s 15%, and we’re at 21,000 cases now, that means 61 days from
08:12
now it’s over 100 million.
08:15
But if through a bit less exposure and infection it drops to 5%, it doesn’t mean the projection
08:21
drops by a factor of 3, it actually drops to around 400,000.
08:25
So if people are sufficiently worried, there’s much less to worry about, but if no one is
08:31
worried, that’s when you should worry.