NASH CREEK PROJECT
PEA Highlights:
- Open pit mine plan with average annual production of 96M pounds of ZnEq. (77M pounds of zinc, 15M pounds of lead and 437K ounces of silver) over a ten year mine life
- Pre-tax IRR of a 34.1% (25.2% post-tax) and a pre-tax NPV8% of C$230M (C$128M post-tax) with a payback period of 2.4 years (2.8 years post-tax)
- Indicated mineral resource totaling 13.6 Mt averaging 3.2% ZnEq. (2.7% Zn, 0.6% Pb and 17.8 g/t Ag) containing 963 million pounds of ZnEq. and an Inferred mineral resource totaling 5.9 Mt averaging 3.1% ZnEq. (2.7% Zn, 0.5% Pb and 14.0 g/t Ag) containing 407 million pounds of ZnEq.
- LOM all-in sustaining costs (“AISC”) of C$0.37 per pound of zinc produced, net by-product credits
- Total pre-production capital costs of C$168 million (including 18% contingency)
- Potential to materially enhance the economic return with additional drilling over the district-scale land package
RECENT NEWS
- Callinex Intersects 67m of 2.73% Copper and 20.53m of 2.58% Copper in Step-outs at the Rainbow Deposit in the Flin Flon Mining District, MB
- Callinex to Commence Drilling Campaign to Follow-up on Silver Discoveries at the Nash Creek Project in Bathurst Mining District, New Brunswick
- Callinex Intersects 4.87m of 14.94% Copper in 90m Step-out from the Rainbow Deposit in the Flin Flon Mining District, MB
Overview
The Nash Creek Property (Property) is located in Restigouche County in northeast New Brunswick and is situated approximately 18 kilometres (km) east of the Port of Belledune and 45 km northwest of city of Bathurst. The Property is comprised of seven contiguous mineral claims, totaling 15,542.31 hectares. Access to the Property is excellent via highway and is adjacent to the nearby Port of Belledune where there is a lead/silver smelter, power plant, deep water port and railway hub with direct access to a zinc smelter in Valleyfield, QC.
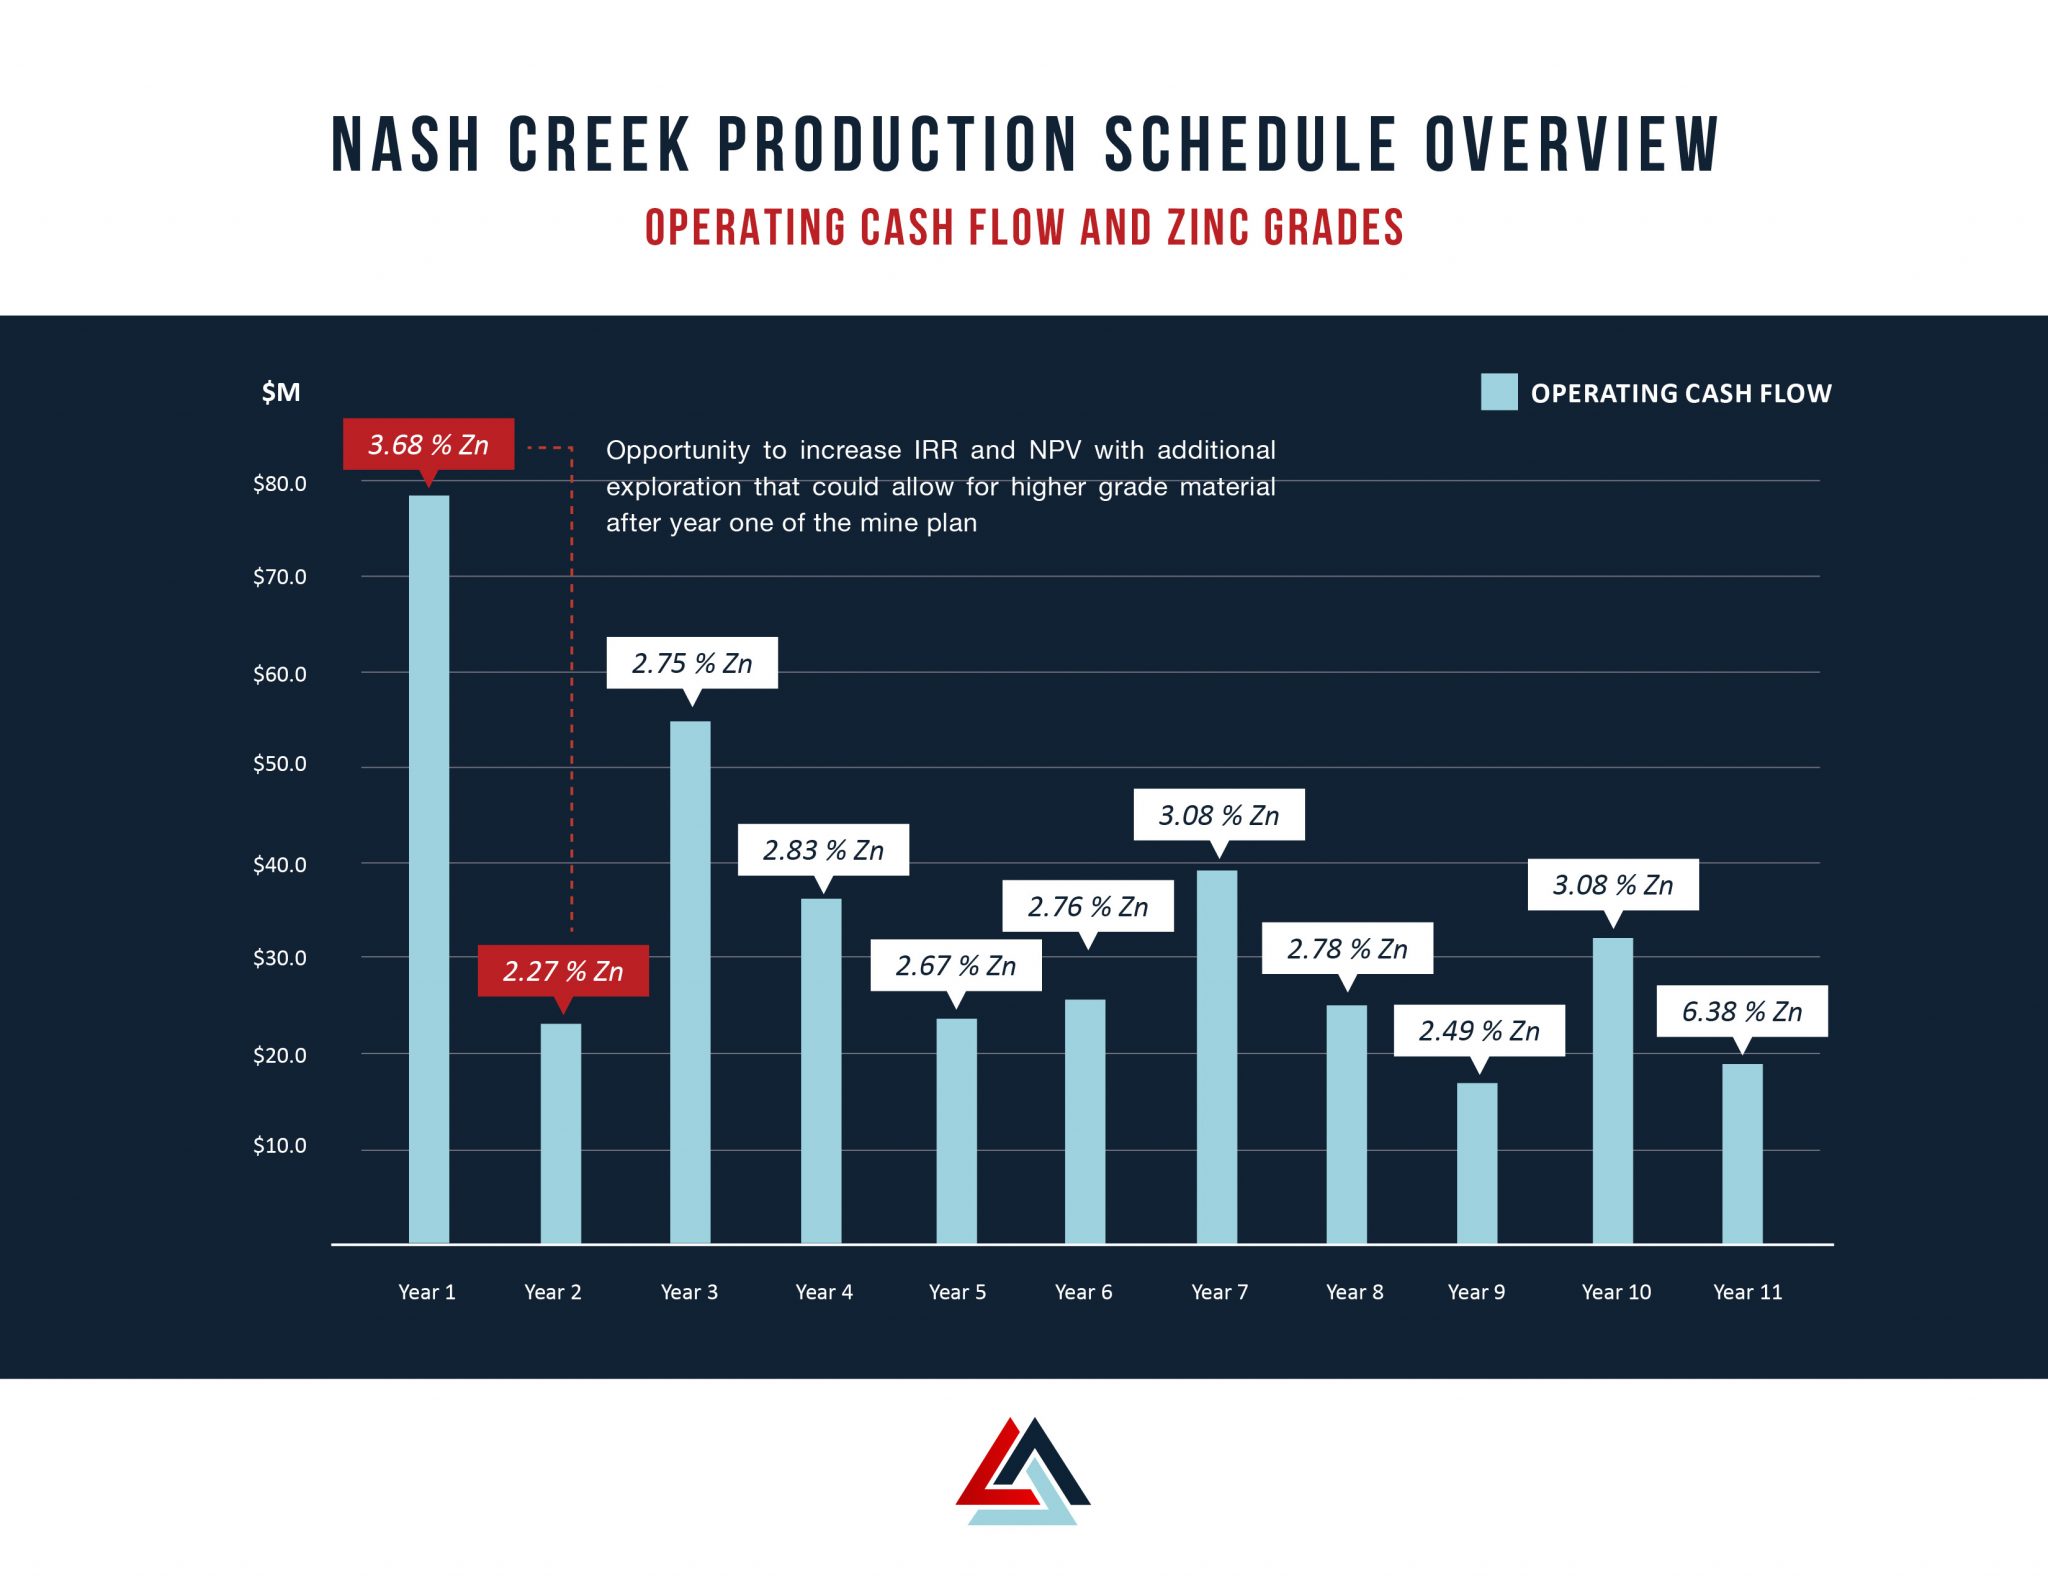
The initial PEA outlines a 10-year, 3,900 tpd open-pit mining operation with a Dense Media Separation (“DMS”) plant and 1,950 tpd conventional flotation process facility at the Nash Creek Project (the “Project”). The mine plan generates a strong economic return with a pre-tax internal rate of return (“IRR”) of a 34.1% (25.2% post-tax) and a pre-tax Net Present Value (“NPV”) at an 8% discount rate of C$230 million (C$128 million post-tax) based on pre-production capital costs of C$168 million and a zinc price of US$1.25/lb (See Tables 1 and 2). The Company believes there is a clear opportunity to significantly enhance the project’s economics with additional exploration that allows for higher grade material to be scheduled earlier in the mine plan
The Nash Creek Deposit (the “Deposit) is a base metal sulphide deposit hosted within the Early Devonian Dalhousie Group volcanics and volcaniclastic bedrock units. It is comprised of two main zones called the Hickey Zone, located to the north and the Hayes Zone, located to the south. Mineralization occurs at surface in the Hayes Zone and extends for approximately 2.1 km along strike, where mineralization consists of sub-horizontal mineralization which is interpreted as a series of vertically stacked horizons within the Hickey Zone. The majority of Zn+Pb+Ag mineral resources within both the Hayes and Hickey zones are located with 250m from surface
The Deposit is open for expansion in several directions with relatively few drill holes located outside of the Mineral Resource area. The 2017 drilling campaign on the Nash Creek Deposit, the first to ever be completed by the Company, led to a 74% increase in Indicated Mineral Resource zinc equivalent (“Zn Eq.”) pounds and a 385% increase in Inferred Mineral Resource zinc equivalent pounds (See News Release dated April 16, 2018). Additionally, the Project encompasses several untested high-grade mineral occurrences over a highly prospective 20 km long trend. The Company plans to commence permitting while aggressively advancing exploration opportunities within this underexplored 150 km² district-scale land package.
**Click Here to Download the 2018 Preliminary Economic Assessment**
**Click Here to Download the 2018 Technical Report and Updated Resource Estimate**
**Click Here for a Video Overview of the Nash Creek Project**

Cautionary Note on PEA.The PEA is preliminary in nature and it includes Inferred Mineral Resources that are considered too speculative geologically to have the economic considerations applied to them that would enable them to be categorized as Mineral Reserves. There is no certainty that the PEA will be realized.The PEA was prepared under the supervision of Eugene Puritch, P. Eng., FEC, CET of P&E Mining Consultants Inc.
Opportunities and Exploration Potential
The Company’s management team is very encouraged about the strong economic results generated from its initial PEA and the opportunities for further improvement with additional exploration, especially considering that only limited drilling has occurred outside of the Mineral Resource area. Notable opportunities for further improvement include:
- Exploration or acquisition activities resulting in the addition of higher-grade material after year one of the mine plan which could have potential to significantly increase the IRR and NPV8% (See Figure 3);
- Expand the 10-year mine life with additional exploration success at the Nash Creek Deposit, which is open for expansion, to increase the NPV8% and evaluate increasing process plant throughput with potential to lower unit costs and increase production volumes; and
- Potential for new discoveries within a 150 km2 land package where a primary north-south corridor has several high-grade mineral occurrences up to 19% Pb+Zn at surface with very limited historic drilling.
Overview of PEA Results and Assumptions
Economic Sensitivities and Indicators
Table 1: Economic Sensitivities and Project Economics
The economic sensitivities and project economics are as follows:
| Parameter | Unit | Base Case | Spot Scenario |
|---|---|---|---|
Zinc Price Lead Price Silver Price Exchange Rate | US$/lb US$/lb US$/oz C$/US$ | $1.25 $1.10 $17.00 0.77 | $1.40 $1.05 $16.70 0.78 |
| Pre-tax Undiscounted Net Cash Flow | C$M | $483.4 | $582.6 |
| Pre-tax NPV5% | C$M | $303.9 | $372.7 |
| Pre-tax NPV8% | C$M | $230.2 | $286.6 |
| Pre-tax IRR | % | 34.1% | 39.2% |
| Pre-tax Payback Period | years | 2.4 | 2.1 |
| After-tax Undiscounted Net Cash Flow | C$M | $292.5 | $350.7 |
| After-tax NPV5% | C$M | $175.7 | $216.2 |
| After-tax NPV8% | C$M | $127.6 | $160.7 |
| After-tax IRR | % | 25.2% | 28.8% |
| After-tax Payback Period | years | 2.8 | 2.6 |
| Net Smelter Return | C$/t DMS plant feed | $80.13 | $87.07 |
| Operating Margin | C$/t DMS plant feed | $49.28 | $56.23 |
| Total Operating Cost (Incl. royalty) | C$/t DMS plant feed | $30.94 | $31.01 |
| Total Operating Cost (Incl. royalty) | C$/lb Zn Produced | $0.30 | $0.31 |
| All-in Sustaining Costs (Excl. G&A) | C$/lb Zn Produced | $0.37 | $0.38 |
Mining and Processing Method
The PEA assumes a conventional truck and excavator open-pit mining operation at an average annual process plant production rate of 1,425,000 tonnes per annum over a mine life of approximately 10 years. Mining operations will reach an annual average total material movement of 10 million tonnes using 11.5 m3 diesel hydraulic excavators, 90 tonne haulage trucks, and track mounted diesel powered drill rigs with up to 200 mm diameter blastholes drilled on 5 and 10 metre height benches.
The mined material will be processed at a new 3,950 tonne per day dense media plant and a 1,950 day tonne per day grinding and flotation plant located on the Project site. Two concentrates will be produced; zinc-silver and lead-silver. It is anticipated that lead concentrates could be processed at the nearby Belledune Smelter and zinc concentrates at Valleyfield, QC. The zinc concentrates also have potential to be processed overseas via the deep water port from Belledune although this alternate option was outside the scope of the PEA and was not investigated. A review of metallurgical test work has not identified any deleterious elements that would impact the marketability of the zinc and lead concentrates, which are considered of good quality.
Table 2: Mine Production Summary(1)
The operating assumptions for the financial model are as follows:
| Parameter | Unit | Base Case |
|---|---|---|
| Mine Life | Years | 10 |
Annual Production in Concentrate Zn Eq. Zinc Lead Silver | M Lbs M Lbs M Lbs M Oz | 95.5 76.7 14.6 0.4 |
Tonnes Mined (LOM) Nash Creek Superjack | Mt Mt Mt | 14.4 13.1 1.3 |
| Strip Ratio (LOM) | Waste to Mill Feed | 6.7 |
DMS Plant Feed Zn Eq. Zinc Lead Silver | % % % g/t | 3.70% 2.88% 0.62% 20.26 |
| DMS Rejection Rate | % | 50.0% |
| DMS Sulphide Loss | % | 7.0% |
| Mill Feed (LOM) | Mt | 7.2 |
Average Head Grade (LOM) Zn Eq. Zinc Lead Silver | % % % % g/t | 6.88% 6.88% 5.36% 1.15% 37.68 |
Average Recovery to Concentrate Zinc (Zinc Concentrate) Lead (Lead Concentrate) Silver (Lead and Zinc Concentrate) | % % % | 90.0% 80.0% 25.0% |
| Zinc in Zinc Concentrate | % | 53.8% |
| Silver in Zinc Concentrate | g/t | 105 |
| Lead in Lead Concentrate | % | 50.3% |
| Silver in Lead Concentrate | g/t | 517 |
Zinc Concentrate Terms Treatment Charge Transportation Cost Payable Rate for Zinc | US$/dmt US$/wmt % | $150 $30 85% |
| NSR from Zinc Concentrate | C$M | $939 |
Lead Concentrate Terms Treatment Charge Transportation Cost Payable Rate for Lead | US$/dmt US$/wmt % | $134 $5 95% |
| NSR from Lead Concentrate | C$M | $217 |
- Zinc equivalent calculation used to reference PEA figures is based on the following metal prices: zinc US$2,755/t (1.25/lb), lead US$2,205/t (1.10/lb), and silver US$17.0 per oz. Metal recoveries of 100% were applied in the metal equivalent calculations. The zinc equivalent calculation is as follows: Zn Eq = 100 ((Ag Price in (g) x Ag Grade) + (Pb Price*2204.6 x Pb Grade(%)/100) + (Zn Price*2204.6 x (Zn Grade(%)/100))/Zn Price*2204.6).
Operating and Capital Costs
Table 3: Operating Cost
The anticipated operating costs are as follows:
| Parameter | Unit | Unit Cost | LOM Costs (C$M) |
|---|---|---|---|
| Mining Cost (Ovb) | C$/t mined | $2.00 | $7.4 |
| Mining Cost (Waste) | C$/t mined | $2.35 | $209.0 |
| Mining Cost (Mineralized) | C$/t mined | $2.75 | $ 39.9 |
| Superjack Ore Transport | C$/t mined | $13.00 | $ 16.8 |
| DMS Processing Cost | C$/t mined | $0.20 | $ 2.9 |
| Flotation Processing Cost | C$/t milled | $13.20 | $95.2 |
| Tailings Handling | C$/t DMS feed | $1.25 | $17.1 |
| Environmental | C$/t DMS feed | $1.44 | $20.8 |
| G&A | C$M/yr | $2.50 | $25.8 |
| Royalty | NSR | 1.0% | $11.6 |
| Total Operating Cost | C$/t mined | $30.94 | $434.8 |
Table 4:Life of Mine Capital Costs
The initial and sustaining capital costs are presented as follows:
| Category | Contingency | Initial (C$M) |
|---|---|---|
| Mine Pre-Stripping | 5% | $10.2 |
| Mining Capital Cost | 20% | $5.3 |
| Process Plant with DMS (Directs) | 20% | $63.1 |
| Infrastructure | 20% | $23.0 |
| Permitting and Tailings | 10% | $16.7 |
| Indirects | 20% | $24.6 |
| Contingency Total | 18% | $31.4 |
| Total Initial Capital Cost | $168.3 | |
| Category | Contingency | Sustaining (C$M) |
| Mine & Equipment Lease | 20% | $31.1 |
| Process Plant with DMS | 10% | $3.0 |
| Closure & Reclamation | 10% | $15.8 |
| Contingency Total | 15% | $8.0 |
| Total Sustaining Capital | $57.9 | |
| Total Capital Cost | $226.2 |
Project Infrastructure
The Project will benefit from infrastructure, services and skilled labour available in the Bathurst Mining Camp. The Nash Creek Project site is located approximately 50 km northwest of the city of Bathurst and is accessible year-round from paved Provincial Highway 11 and a 1 km paved road. Project site infrastructure is anticipated to include:
- Plant site and haul roads;
- Administration buildings and assay lab;
- Mine maintenance shop, warehouse and fuel storage facilities;
- Fresh water supply and sewage treatment; and
- Lined tailings storage area.
The proposed Nash Creek Project mill and process plant site is ideally located on the access road to the open pit and on private land owned by Callinex. The proposed processing plant site is located on a relatively flat area adjacent to the open pit. A small creek valley to the west of the open pit provides a suitable site for a dammed tailings management facility for the first 4 years of mine life. Thereafter, tailings will be deposited into the first small pit area to be mined out. Power to the site will be supplied by a 1 km transmission line connecting to the nearby 230 kV provincial grid.
Environmental, Permitting and Taxes
The PEA envisages potential to create approximately 225 jobs if the project is advanced into production. The project could have a major impact within the surrounding communities of Lorne and Belledune, where there are limited number of economic opportunities resulting in a unemployment rate exceeding 20%. The nearby cities of Bathurst and Cambellton located within 50 km to the Project also have higher unemployment rates of approximately 11%. In addition to the potential for direct job creation, the PEA outlines gross taxes and royalty payable to the Province of New Brunswick of approximately $130 million and approximately $64 million to the Government of Canada (See Table 6).
The Nash Creek Project will be subject to federal, provincial and local regulatory requirements. The principal provincial legislation related to the approval of mining projects and environmental impact assessment (EIA) and are the New Brunswick Mining Act and General Regulation 86-98 of The Clean Environment Act and EIA Regulation 87-83, and Water Quality Regulation 82-126. Relevant key federal legislation includes the Canadian Environmental Assessment Act, Fisheries Act and Metal Mining Effluent Regulations. The New Brunswick Department Energy and Resource Development has provided a concise guide to the mine approval process.
The relatively low sulphide content of the Nash Creek mineralization is anticipated to have low waste rock ARD potential. Additionally, identifiable ARD material will be placed in the mined out open pits at the end of the Project life.
Table 5: Taxes Payable
| Parameter | Unit | Tax Rate | Taxes Paid |
|---|---|---|---|
| Federal Income Tax | C$M | 15.0% | $63.2 |
| New Brunswick Income Tax | C$M | 14.0% | $58.9 |
| NB Net Profit Mining Tax | C$M | 16.0% | $61.6 |
| NB Net Revenue Tax | C$M | 2.0% | $17.2 |
| Gross Tax Payable | C$M | 40.2% | $200.9 |
Conceptual Toll Milling Scenario
P&E investigated the concept of transporting the mined mineralized material with DMS upgrading to a hypothetical toll milling facility within the Bathurst Mining District located 100 km from the Nash Creek Project. Transport costs of C$15/tonne and toll processing costs of C$24/tonne were assumed. This scenario provided robust economic return on capital with a pre-tax IRR of 46.9% (32.3% post-tax)and a pre-tax NPV8% of C$125 million (C$69 million post-tax) with a pre-production capital cost of $62.2M
Mineral Resource Estimates Incorporated in PEA
The PEA mine plans assumes that 14.4 million tonnes of diluted mineralized material grading 3.1% Zn Eq. (2.9% Zn, 0.6% Pb and 20.3 g/t Ag) is delivered to the DMS plant. The table below outlines the total Indicated and Inferred Mineral Resources (See News Release dated April 16, 2018), including those that were not included within the mine plan.
Table 6: Mineral Resource Estimates for the Nash Creek and Superjack Projects
| Indicated Mineral Resources | Indicated Mineral Resources | Indicated Mineral Resources | Indicated Mineral Resources | Indicated Mineral Resources | Indicated Mineral Resources | Indicated Mineral Resources | Indicated Mineral Resources | Indicated Mineral Resources |
|---|---|---|---|---|---|---|---|---|
| Project | Tonnes | Zn Eq. (%) | Zn (%) | Pb (%) | Ag (g/t) | Cu (%) | Contained Zn Eq. (M lbs) | Contained Zn Eq. (M lbs) |
| Nash Creek | 13,592,000 | 3.21 | 2.68 | 0.58 | 17.8 | n/a | 963.4 | 963.4 |
| Total | 13,592,000 | 3.21 | 2.68 | 0.58 | 17.8 | n/a | 963.4 | 963.4 |
| Inferred Mineral Resources | Inferred Mineral Resources | Inferred Mineral Resources | Inferred Mineral Resources | Inferred Mineral Resources | Inferred Mineral Resources | Inferred Mineral Resources | Inferred Mineral Resources | Inferred Mineral Resources |
| Project | Tonnes | Zn Eq. (%) | Zn (%) | Pb (%) | Ag (g/t) | Cu (%) | Contained Zn Eq. (M lbs) | Contained Zn Eq. (M lbs) |
| Superjack | 3,211,000 | 4.63 | 3.01 | 0.78 | 29.5 | 0.27 | 327.6 | 327.6 |
| Nash Creek | 5,929,000 | 3.11 | 2.68 | 0.47 | 13.9 | n/a | 407.1 | 407.1 |
| Total | 9,140,000 | 3.64 | 2.80 | 0.58 | 19.4 | 0.09 | 734.7 | 734.7 |


Notes:
- Mineral Resources are categorized according to CIM Definition Standards; it cannot be assumed that all or any part of Inferred Mineral Resources will be upgraded to Indicated or Measured as a result of continued exploration.
- The Nash Creek Mineral Resource Estimate includes the Hickey Zone and Hayes Zone.
- The Superjack Mineral Resource Estimates includes the Nepisiguit A (the “A Zone”) and Nepisiguit C Zones (the “C Zone”).
- Zinc equivalent Mineral Resources for the Nash Creek Project based on trailing 3-year metal prices and metallurgical recovery assumptions based on limited testwork. Zinc equivalency is calculated as Zn%+ 0.747*Pb% + 0.006*Ag_ppm.
- A cut-off grade of 1.5% Zn Eq. was utilized in the resource estimate.
- Zinc equivalent Mineral Resources for the Superjack Project were calculated using metal prices of $1.12/lb for zinc, $1.06/lb for lead, $2.97/lb for copper and $20.38/oz for silver. Metal recoveries have been assumed to be 100% for zinc, 72% for lead, 86% for copper and 70% for silver. A cut-off grade of 1.5% Zn Eq. was utilized in the Mineral Resource Estimate.
**Figure 1: Map of the Bathurst Mining District of New Brunswick**
 **
**Figure 2: Nash Creek Land Package**[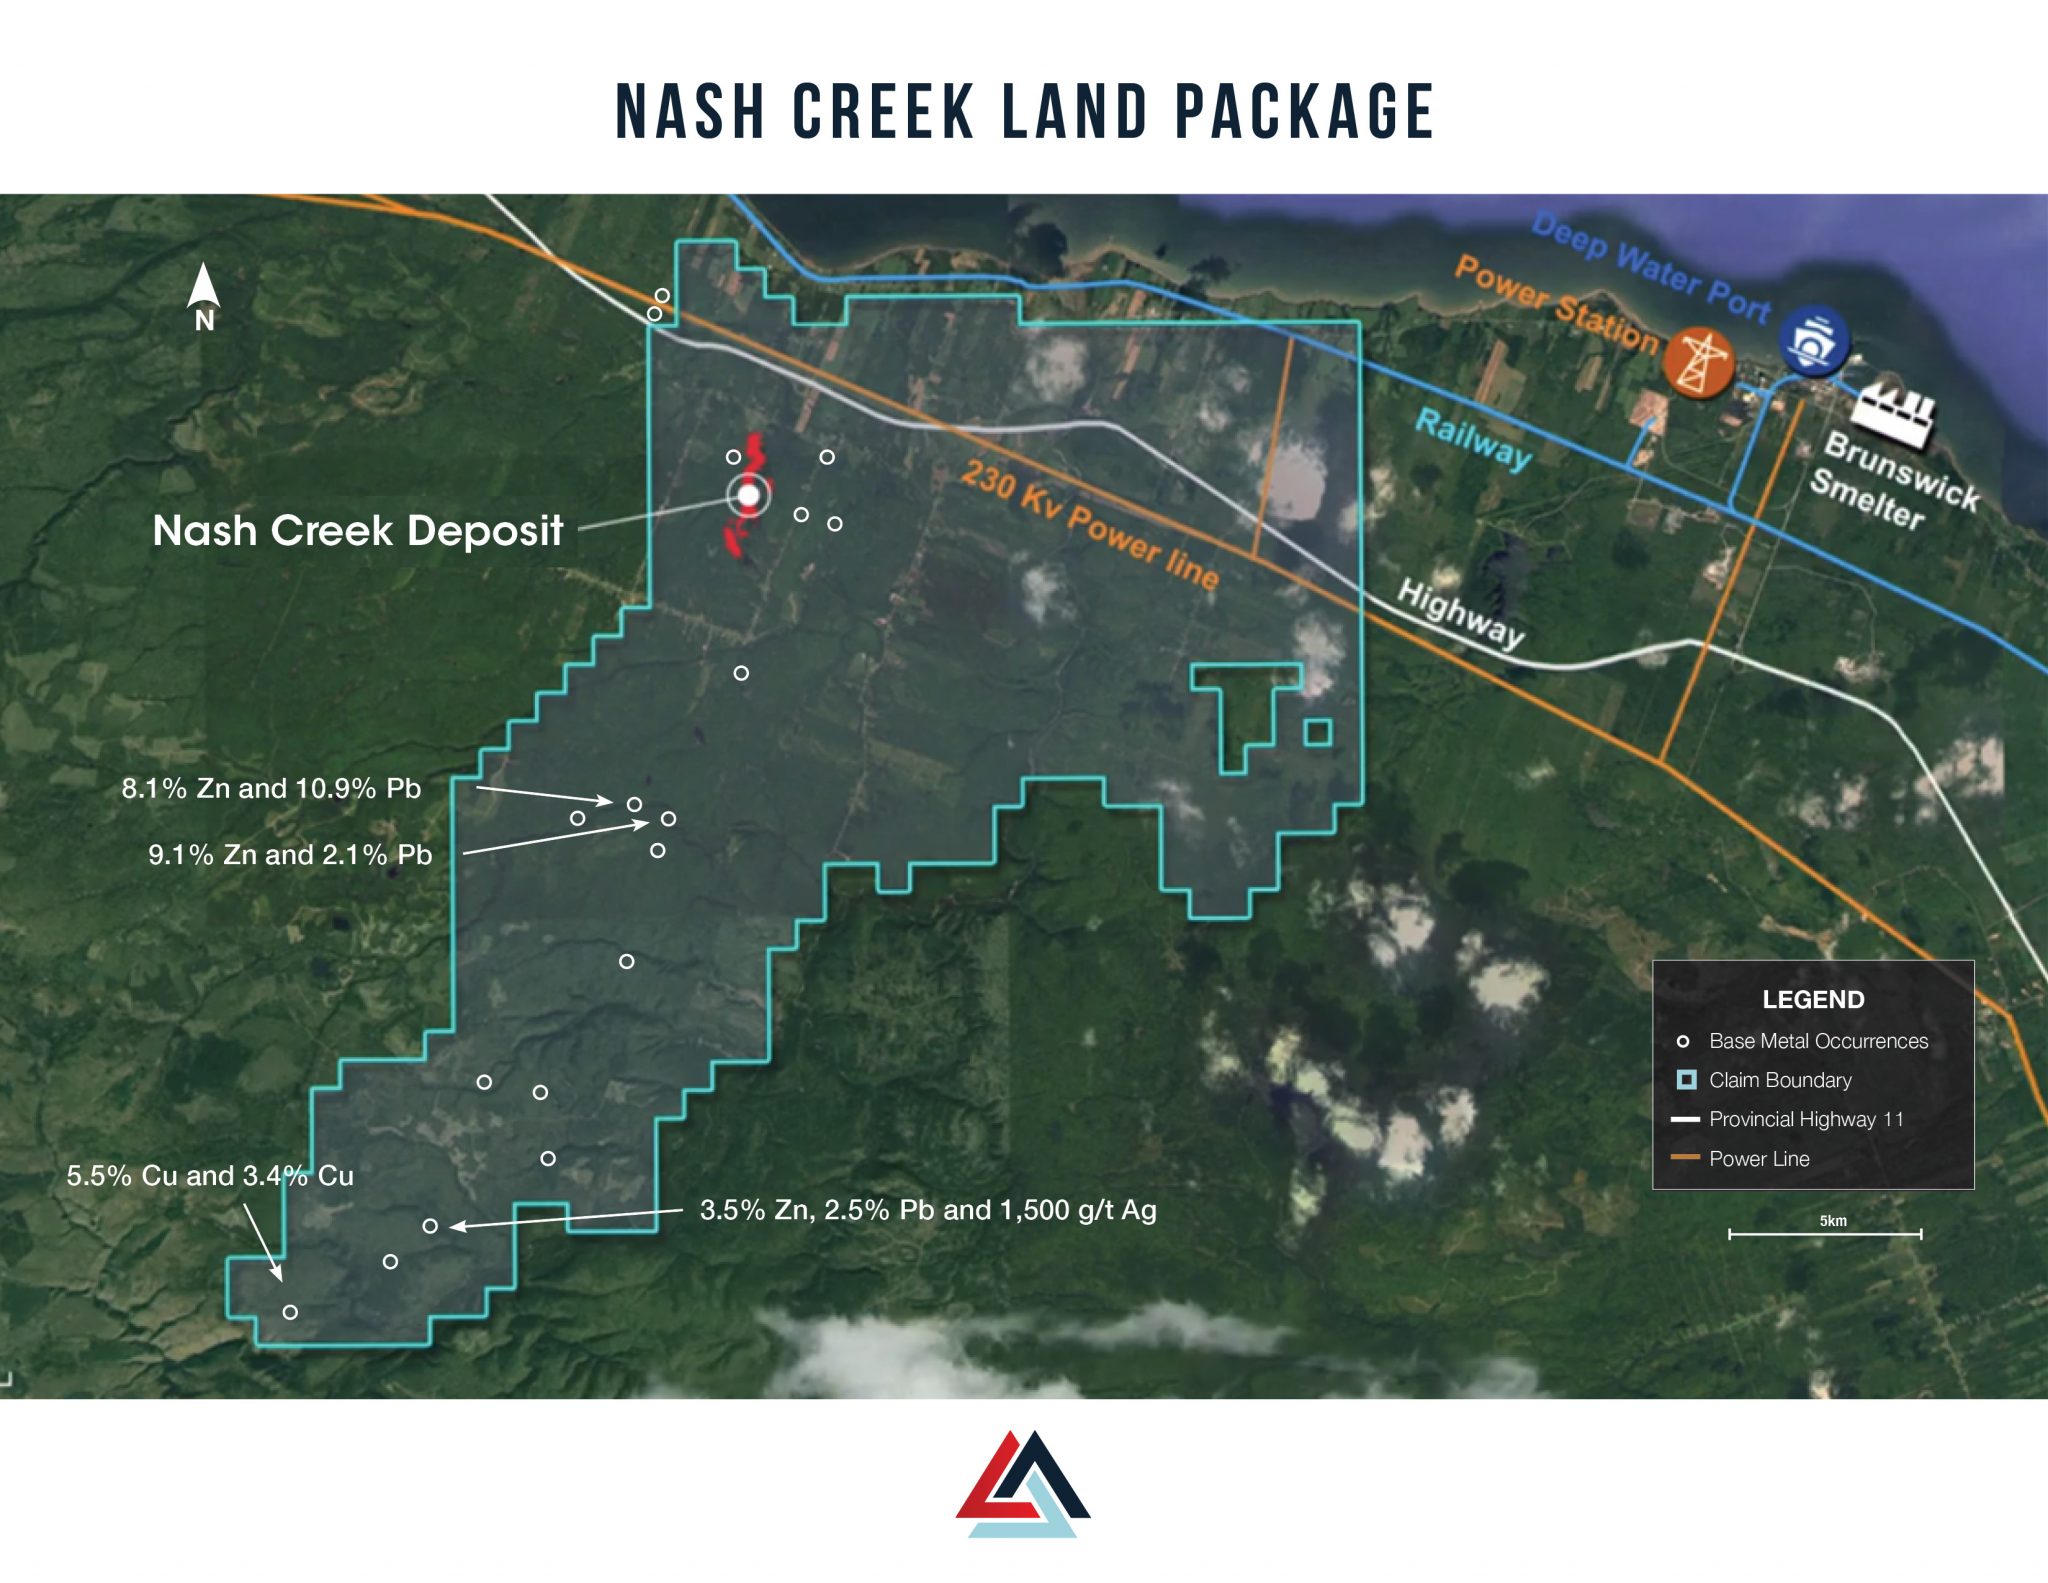 ](https://callinex.ca/wp-content/uploads/2018/05/Figure-2-Nash-Creek-Land-Package-.jpg)
**Figure 3: Nash Creek Production Schedule Overview – Operating Cash Flow and Zinc Grades**
[ ](https://callinex.ca/wp-content/uploads/2018/05/Figure-3-Nash-Creek-Production-Schedule-Overview-Operating-Cash-Flow-and-Zinc-Grades-.jpg)
**Figure 4: Nash Creek Provides Leverage to Zinc and Lead Price**s[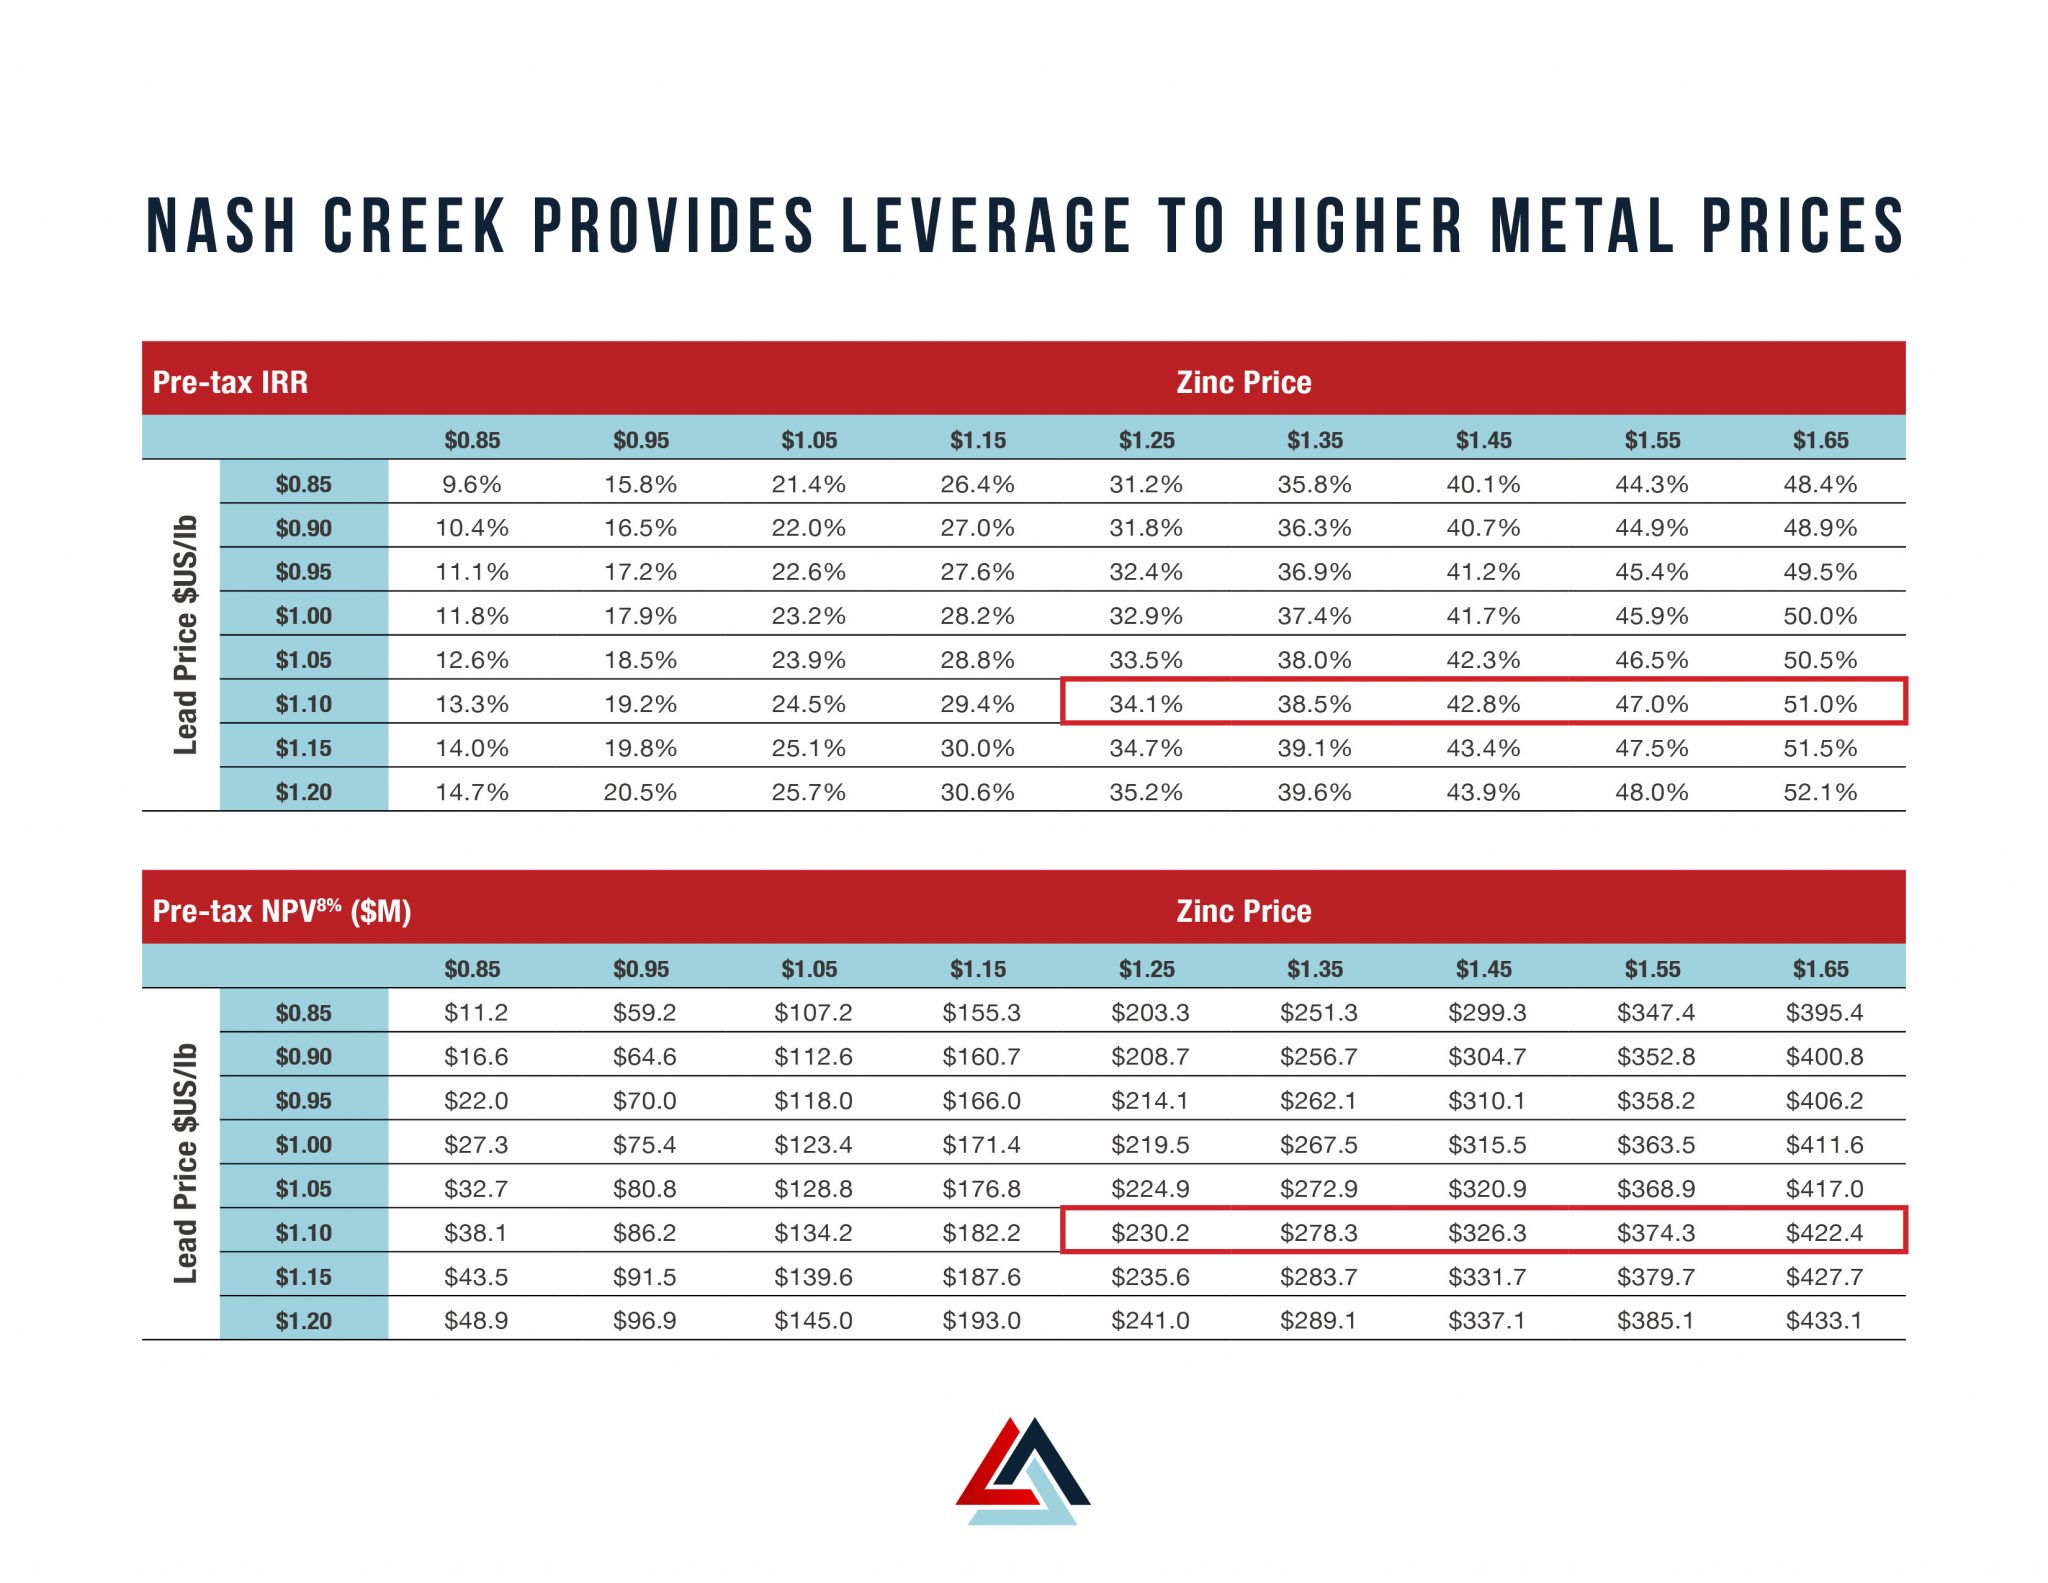 ](https://callinex.ca/wp-content/uploads/2018/05/Figure-4-Nash-Creek-Provides-Leverage-to-Zinc-and-Lead-Prices-.jpg)**Figure 5: Conceptual Nash Creek Open Pit with Mineral Resources**
 **


Qualified Persons Statement
The PEA was prepared under the supervision of Eugene Puritch, P. Eng., FEC, CET of P&E Mining Consultants Inc. Mr. Puritch is an independent Qualified Person in accordance with NI 43-101 and has reviewed and approved the technical contents noted above.