HR-Diagram
The Hertzsprung–Russell diagram
The study of stars, hindered by limited information on individual stars other than the Sun, relies on statistical analyses of a large sample. General trends, such as the relationship between brightness, temperature, and size, provide crucial insights into theories of stellar structure. Shared properties among many stars are considered indicative of fundamental physical laws governing stellar composition.
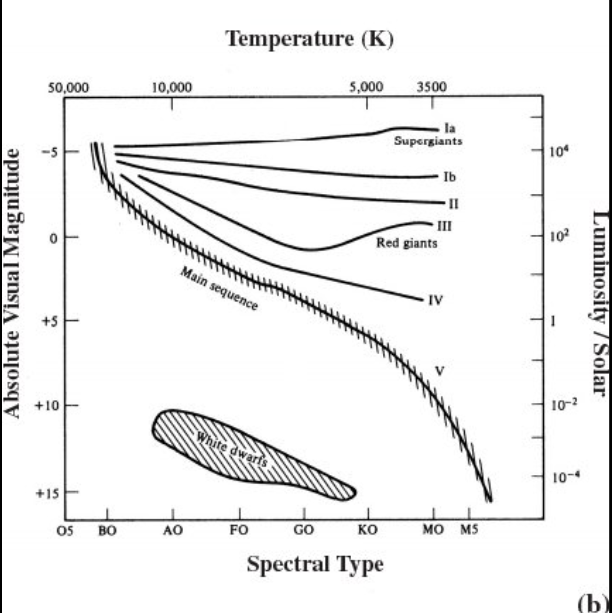
A pivotal early statistical study by astronomers Enjar Hertzsprung and Henry Norris Russell in 1910 involved creating an HR diagram, a cornerstone in stellar astronomy. This diagram, plotting temperature against luminosity, aids in understanding stellar characteristics.
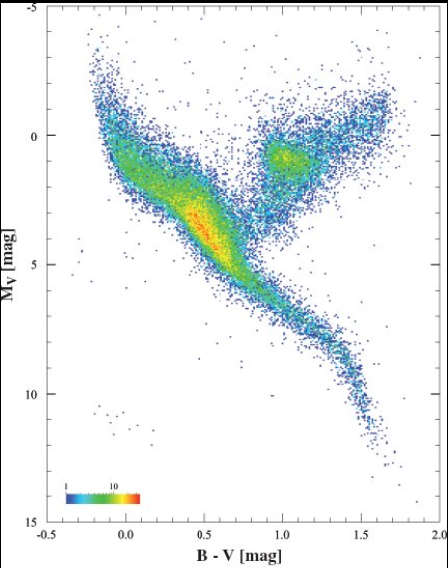
Comparing apparent magnitudes among stars at different distances requires corrections for absolute magnitudes. Studying stars at the same distance, as in star clusters, facilitates direct comparisons on an HR diagram, revealing restrictions on temperature, luminosity, and radius combinations.
Most stars, located in the main sequence, exhibit similar luminosity and size for the same temperature. This relationship, suggesting the influence of physics laws, serves as a crucial test for theories of stellar structure. Stars deviating above the main sequence are giants, categorized into subgiants, giants, and supergiants.
Luminosity classes (Roman numerals) appended to spectral types indicate star size. Main sequence stars belong to class V, with subgiants (IV), giants (III), and supergiants (I) further divided into Ia and Ib based on size. Spectral line observations provide insights into a star's size, influenced by surface gravity.
Some stars appear below the main sequence, known as white dwarfs, being smaller and fainter. It's essential not to confuse dwarfs (main sequence stars) with white dwarfs, which are considerably smaller.