3. SenseMaker® Analysis
Data visualization is the graphical representation of information and data to help people understand and interpret complex datasets more easily.
SenseMaker® software does the following:
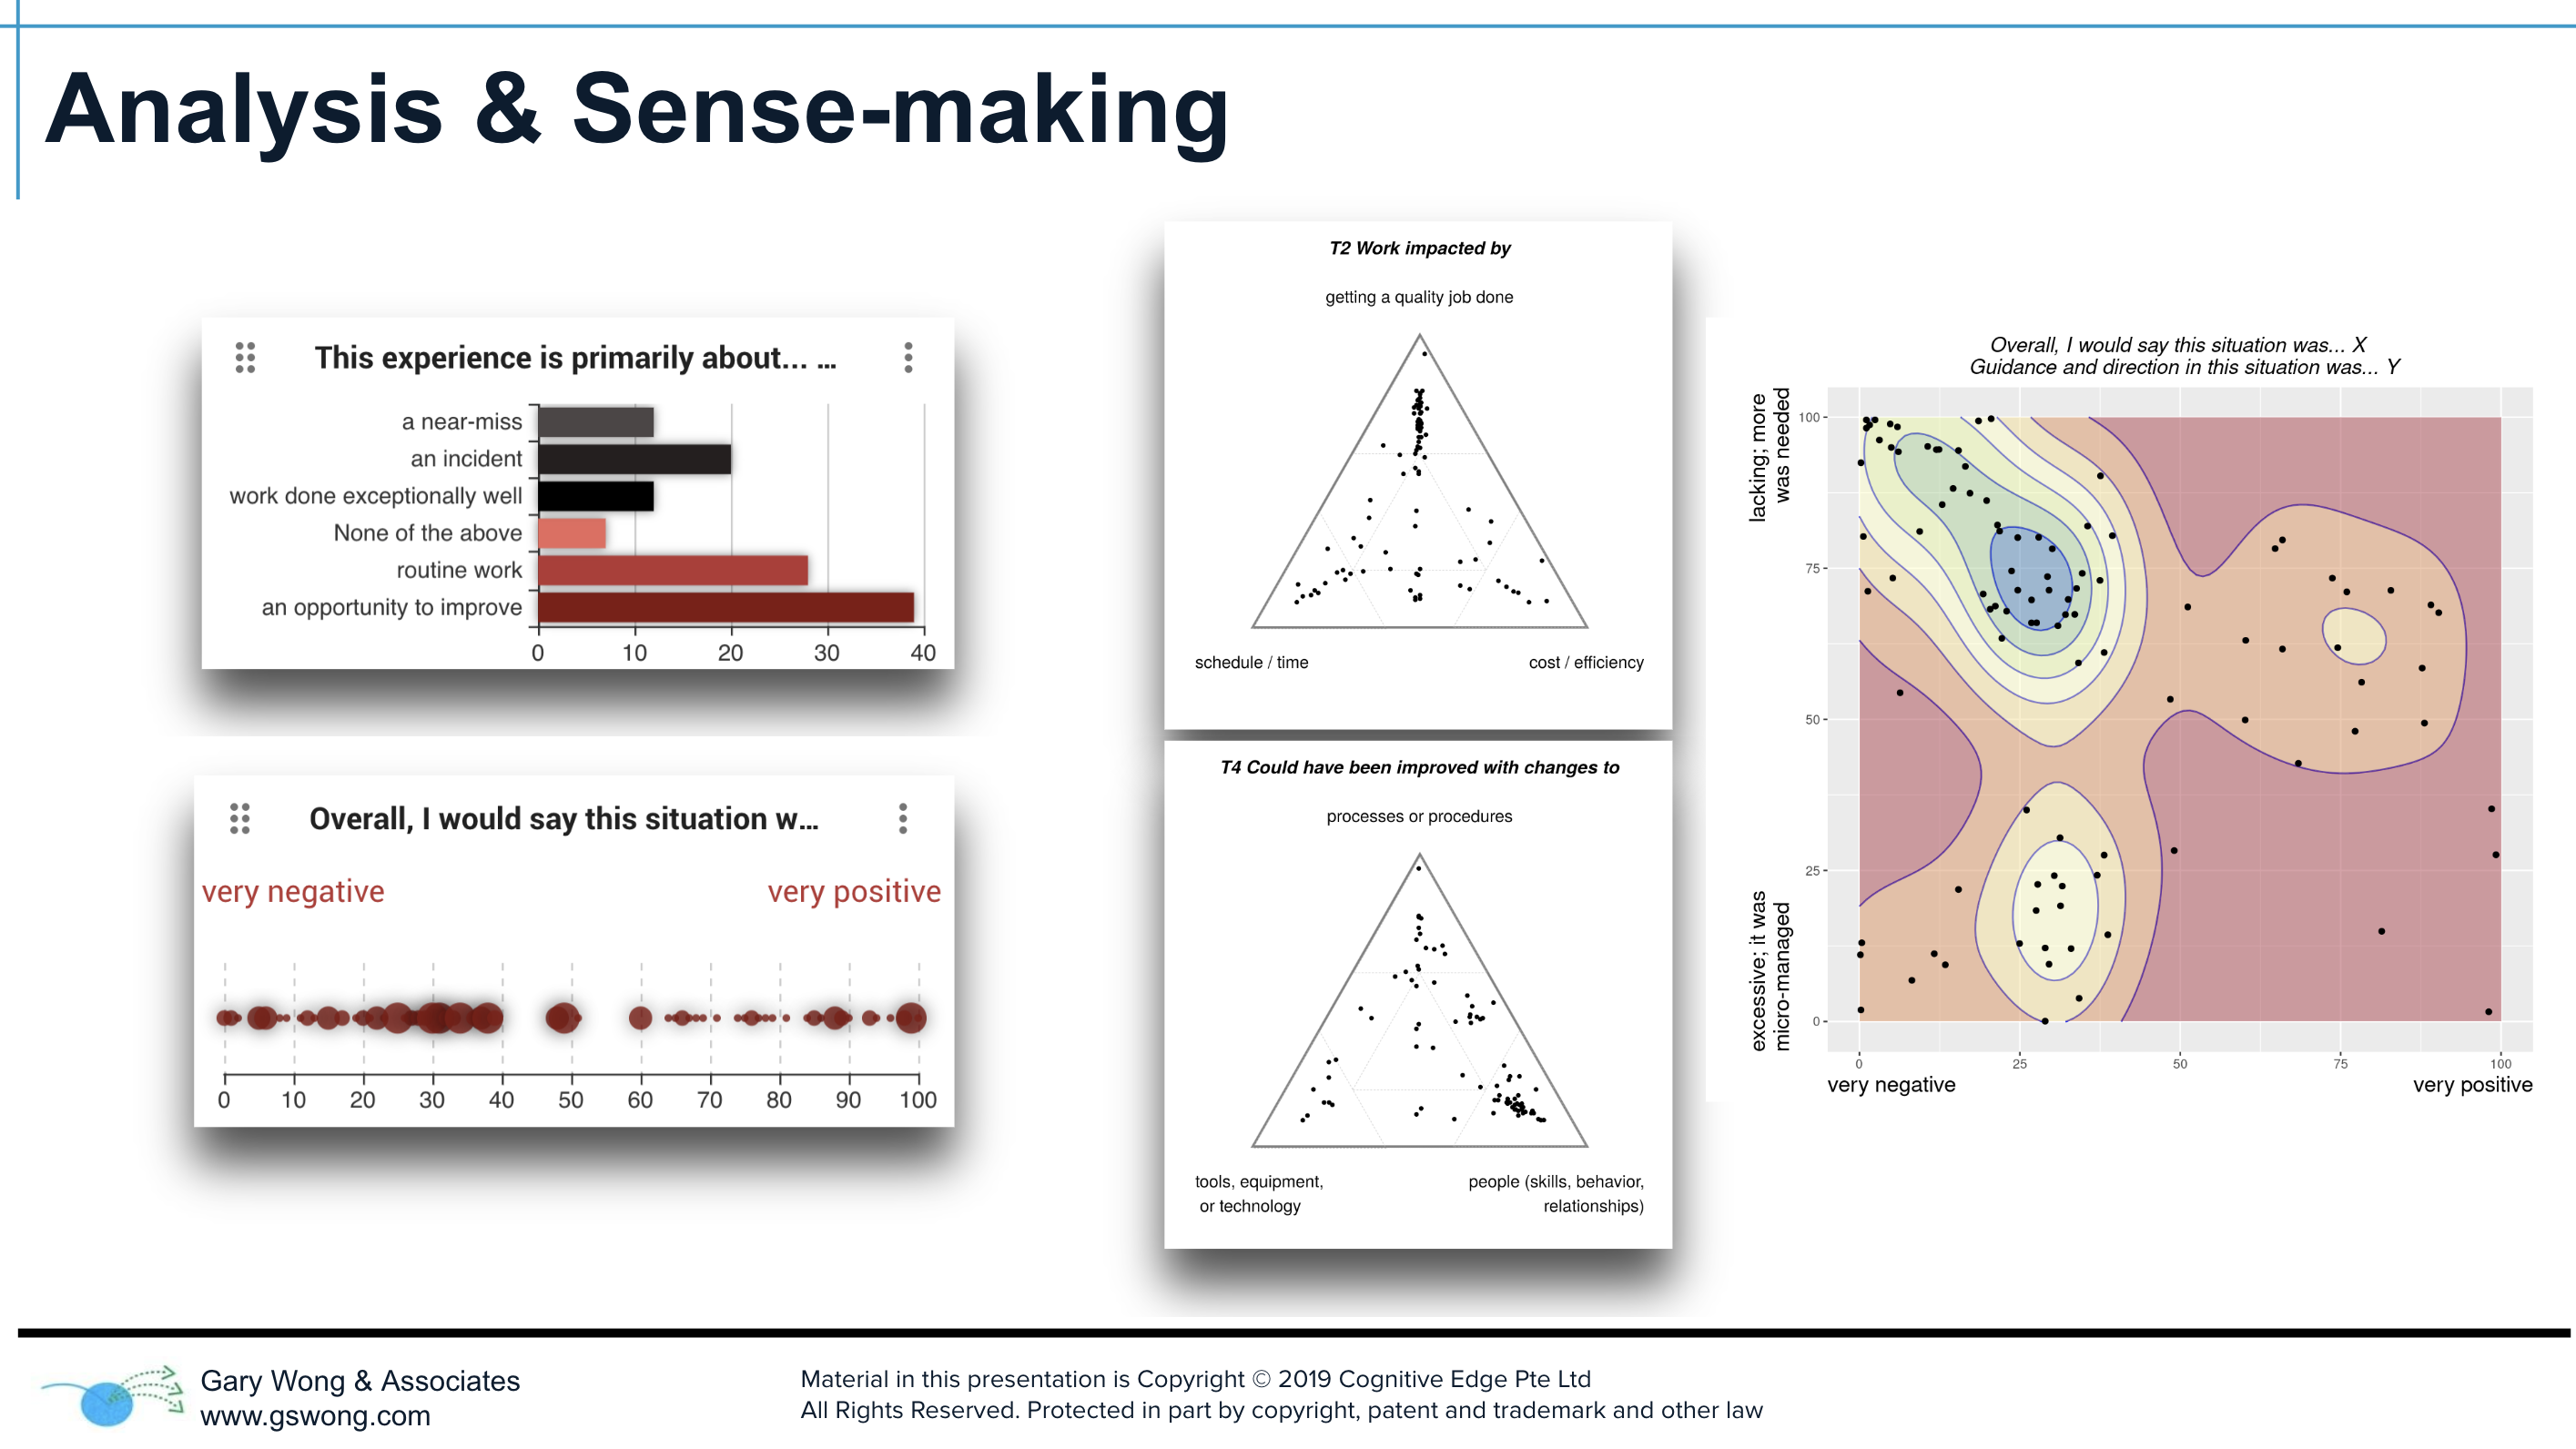
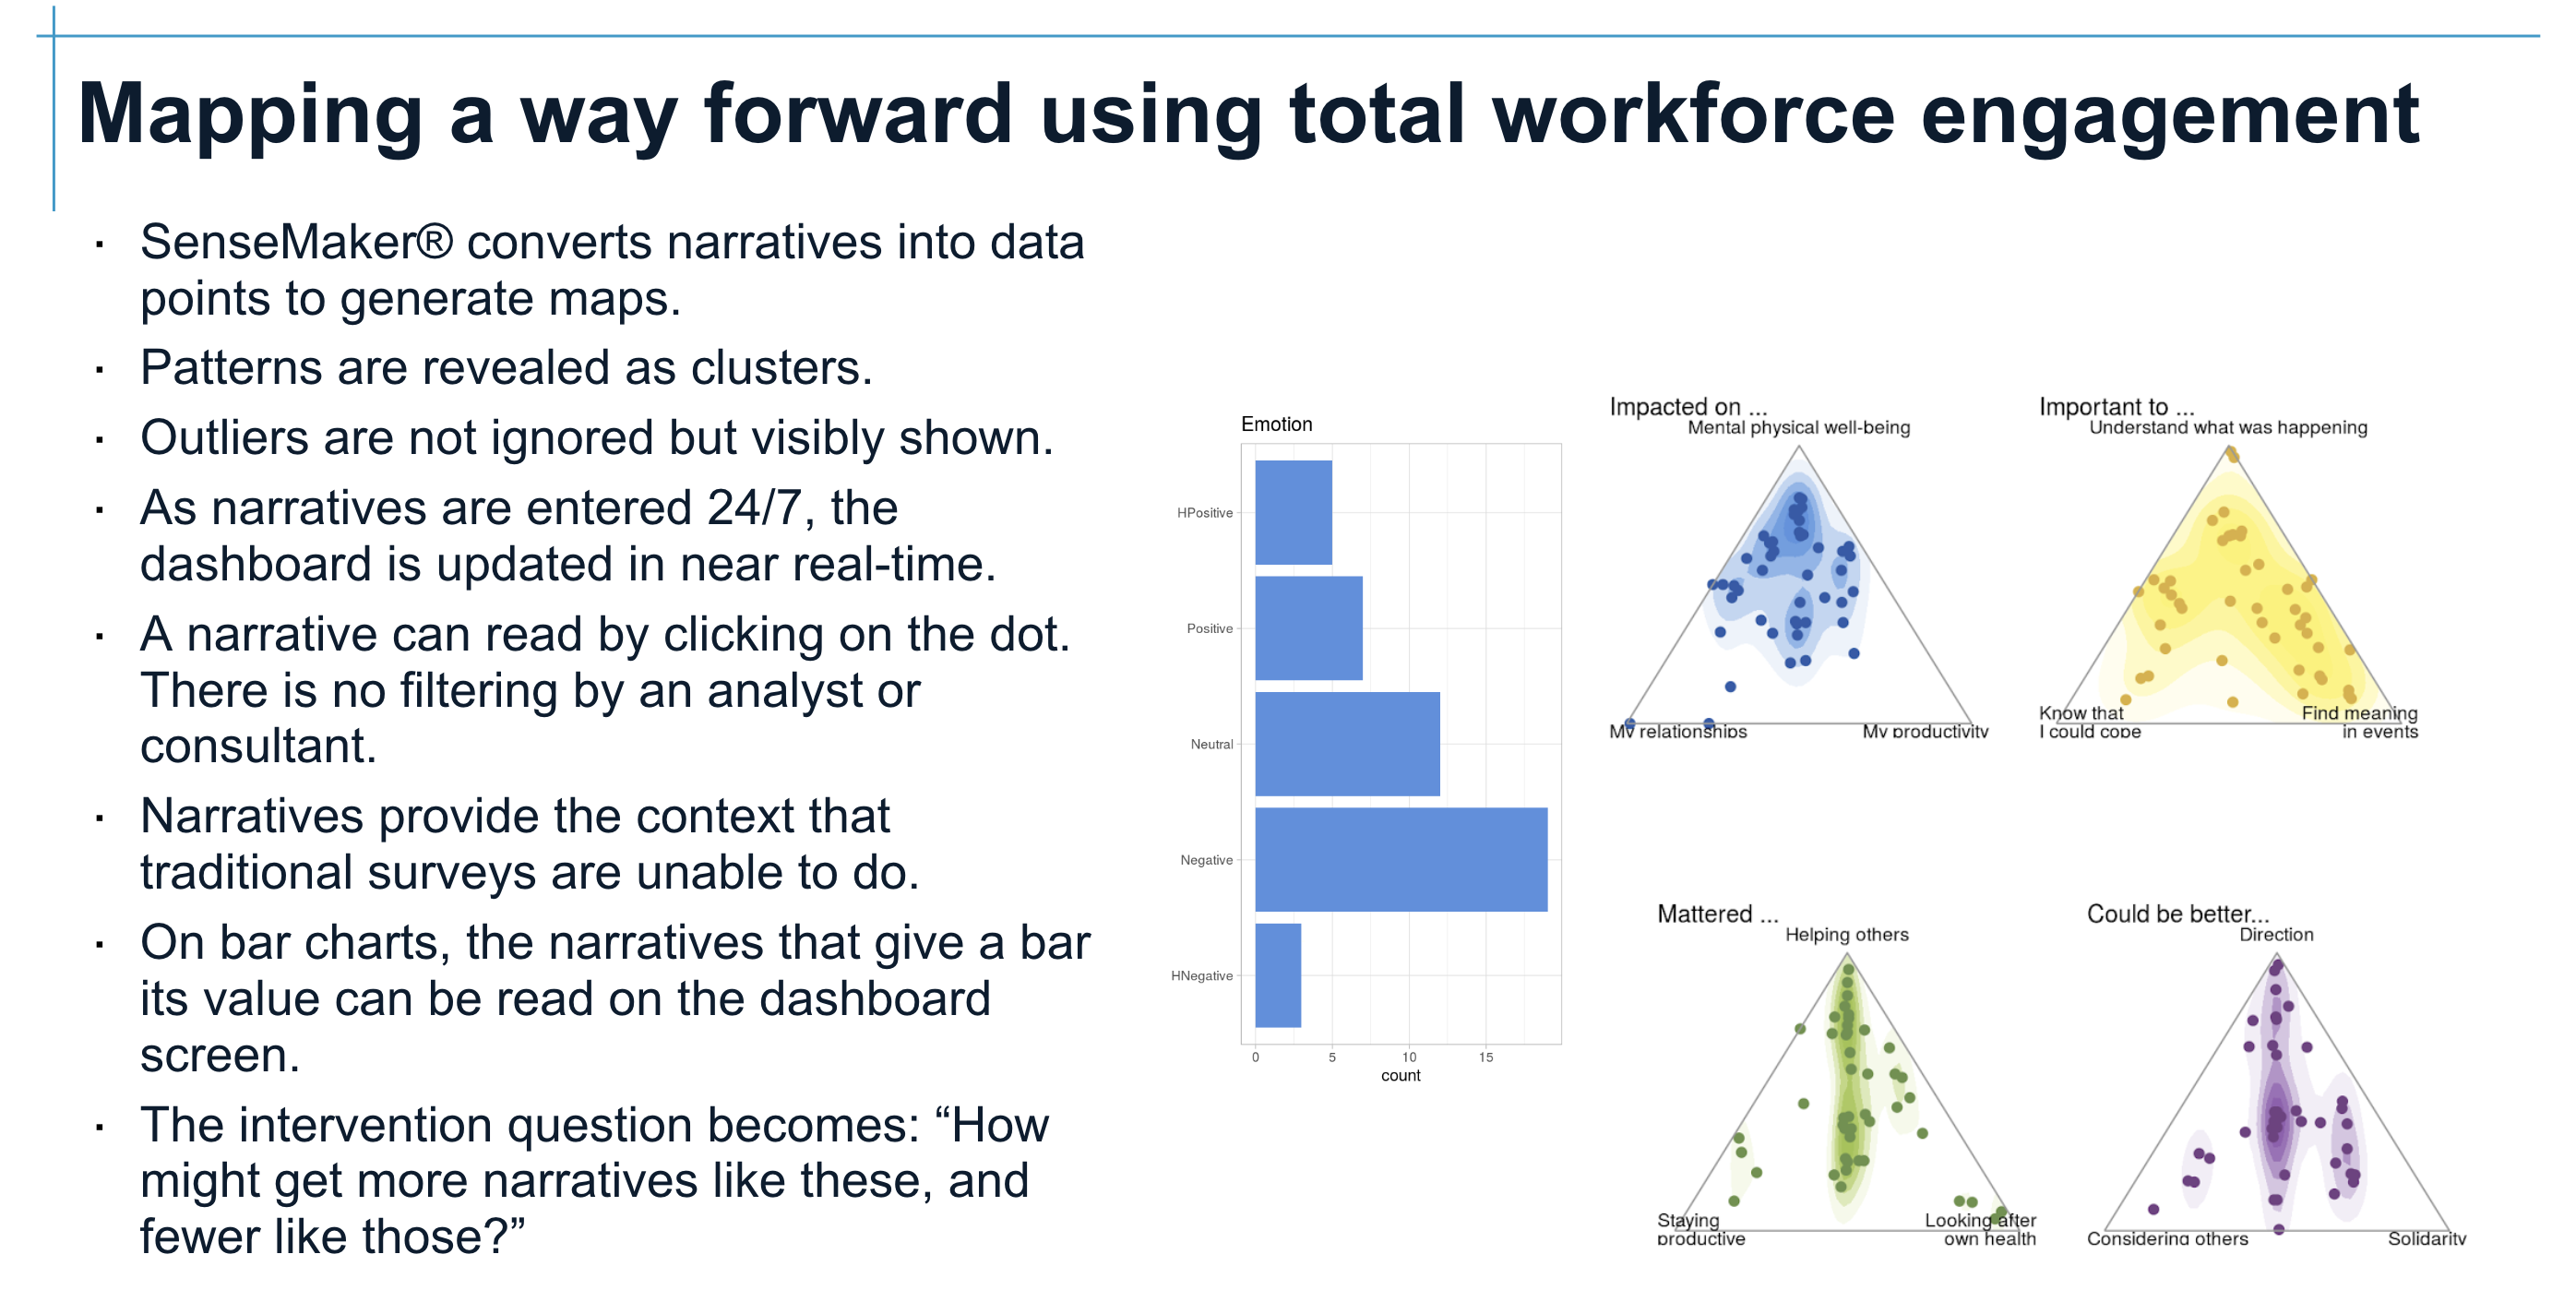
- With the tagging of signifiers, qualitative narrative data is mathematically converted into quantitative data
- Quant data generates charts, graphs, maps, and other interactive tools to present data in a visually engaging and meaningful way.
- Dashboard is an “at a glance” view
- Workbench is a deeper analysis of the data
- Visual patterns are backed with explanatory micro-narratives
- Each dot shown is a narrative which can be read with a simple click